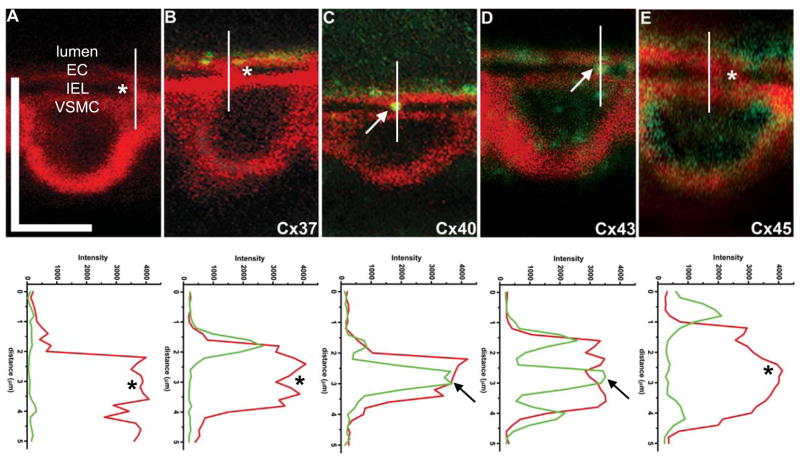
Figure 3. Connexin expression on the actin bridges.
A, in control conditions with phalloidin (red) and secondary antibody alone, there is no apparent staining at the actin bridges. In B, there is no Cx37 (green) evident on the actin bridge. C, Staining for Cx40 (green) is found on the actin bridge. D, Cx43 (green) is also found on the actin bridge and in E, Cx45 (green) expression is not found on the actin bridges. Vertical white lines running through the actin bridges correspond to the intensity plots below each image. In these plots, the intensity of the fluorescence in red (actin) and green (connexin) are plotted against the distance (in μm). Asterisks indicate unstained actin bridges whereas arrows demonstrate protein expression on the actin bridges. In A, vertical bar is 10 μm and horizontal bar is 5 μm and is representative for all images.

