
Figure 5. Determination of antibody threshold detection on the actin bridges.
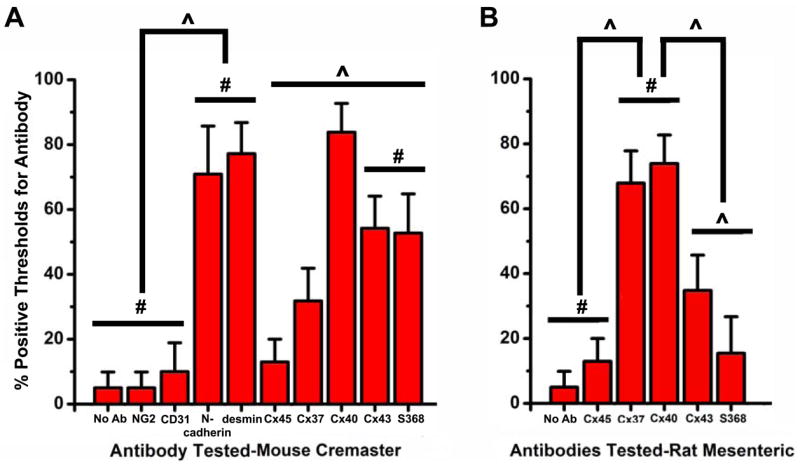
Using the methods described in Materials and Methods and in Fig 2, histograms of percent of time that a proteins could be detected on an actin bridge was plotted in A, mouse cremaster arterioles and B, rat mesenteric arteries. Bars are standard deviation. The symbol “#” represents no significant difference; “^” represents a significant difference.