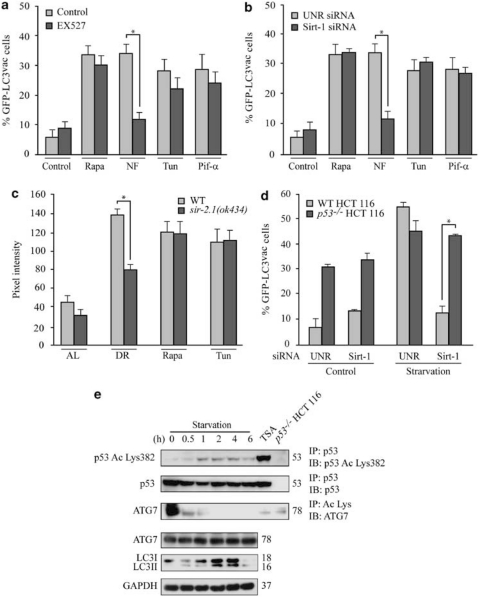
Figure 3.
Role of Sirtuin-1 (Sirt-1) in starvation-induced autophagy. (a, b) Sirt-1 requirement for the induction of autophagy by nutrient deprivation in cancer cells. Wild-type (WT) HCT 116 cells were transfected with a GFP-LC3-encoding construct for 24 h and then cultured for additional 6 h in nutrient-free (NF) conditions or treated with 1 μM rapamycin (Rapa), 2.5 μM tunicamycin (Tun), 30 μM cyclic pifithrin-α (Pif-α) in the presence or absence of 100 μM EX527 (a). (b) Alternatively, WT HCT 116 cells were transfected with control or a Sirt-1-depleting siRNA and subsequently with a plasmid for the expression of GFP-LC3 for 24 h, followed by culture in autophagy-inducing conditions as in a. The percentage of cells exhibiting the accumulation of GFP-LC3 in cytoplasmic puncta (GFP-LC3vac) is reported (mean±S.E.M., n=3, *P<0.05). (c) Requirement of the C. elegans Sirtuin-1 ortholog, SIR-2.1, for starvation-induced autophagy. Autophagy was assayed in WT animals and sir-2.1(ok434) deletion mutants expressing the DsRed::LGG-1 transgene, which were fed ad libitum (AL), grown under conditions of dietary restriction (DR), or treated with 2 μg/ml Tun or 1 μg/ml Rapa. Columns illustrate mean pixel intensity of DsRed::LGG1 (mean±S.E.M., n=3, *P<0.05). (d) WT and p53−/− HCT 116 cells were transfected with the indicated siRNAs, re-transfected with a GFP-LC3-encoding plasmid for 24 h and then cultured for further 6 h in control or starvation conditions. Columns depict the percentage of GFP-LC3vac cells (mean±S.E.M., n=3, *P<0.05). (e) Immunoprecipitation of endogenous p53 and lysine-acetylated proteins. HCT 116 cells of the indicated genotype were cultured in starvation conditions or treated with 70 nM trichostatin (TSA, positive control for acetylation) for 6 h, followed by immunoprecipitation of p53 or lysine-acetylated proteins and immunoblotting for the detection of p53 acetylated on Lys382 (Ac Lys382 p53), total p53, or ATG7. Alternatively, total proteins were assayed for ATG7 abundance and LC3 maturation. Glyceraldehyde-3-phosphate dehydrogenase (GAPDH) levels were determined to monitor the equal loading of lanes. Results are representative of three independent experiments. Numbers next to bands indicate MW (kDa)

