
Figure 5. Electrostatic plots of TonB proteins.
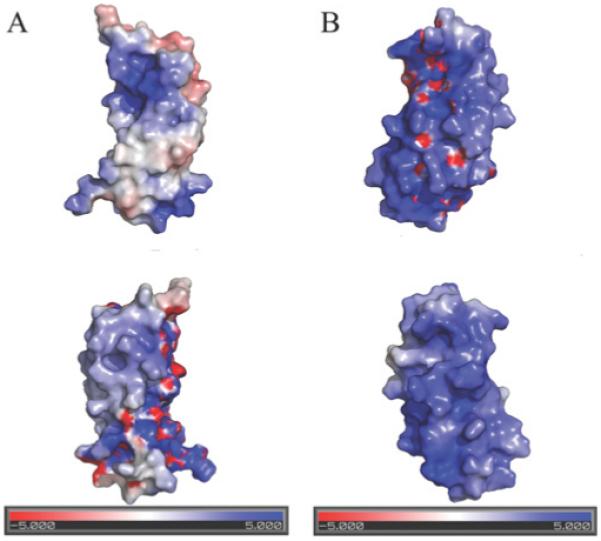
(A) V. anguillarum TonB2 CTD; the top surface diagram is in the same orientation as in Figure 4, and the bottom is rotated 180° around the y-axis. (B) E. coli TonB CTD; the top surface diagram is in the same orientation as in (A), and the bottom is rotated 180° around the y-axis. The electrostatic potential was calculated using the APBS (http://apbs.sourceforge.net/) plugin for Pymol (http://pymol.sourceforge.net/).