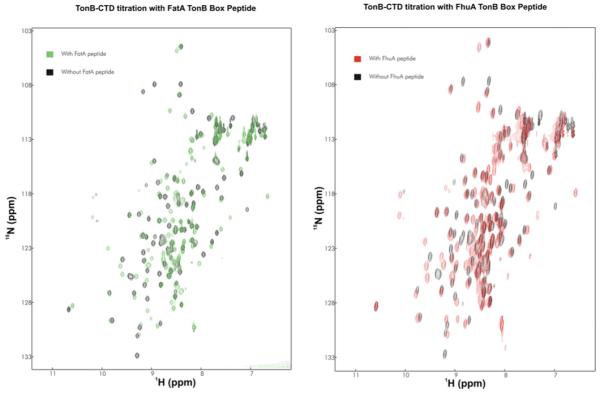
Figure 7. Titration of E. coli TonB CTD with FhuA and FatA peptides.

Left-hand panel: 1H/15N-HSQC spectrum of E. coli TonB CTD with (green) and without (black) the FatA TonB box peptide. Right-hand panel: 1H/15N-HSQC spectrum of E. coli TonB CTD with (red) and without (black) the FhuA TonB box.
