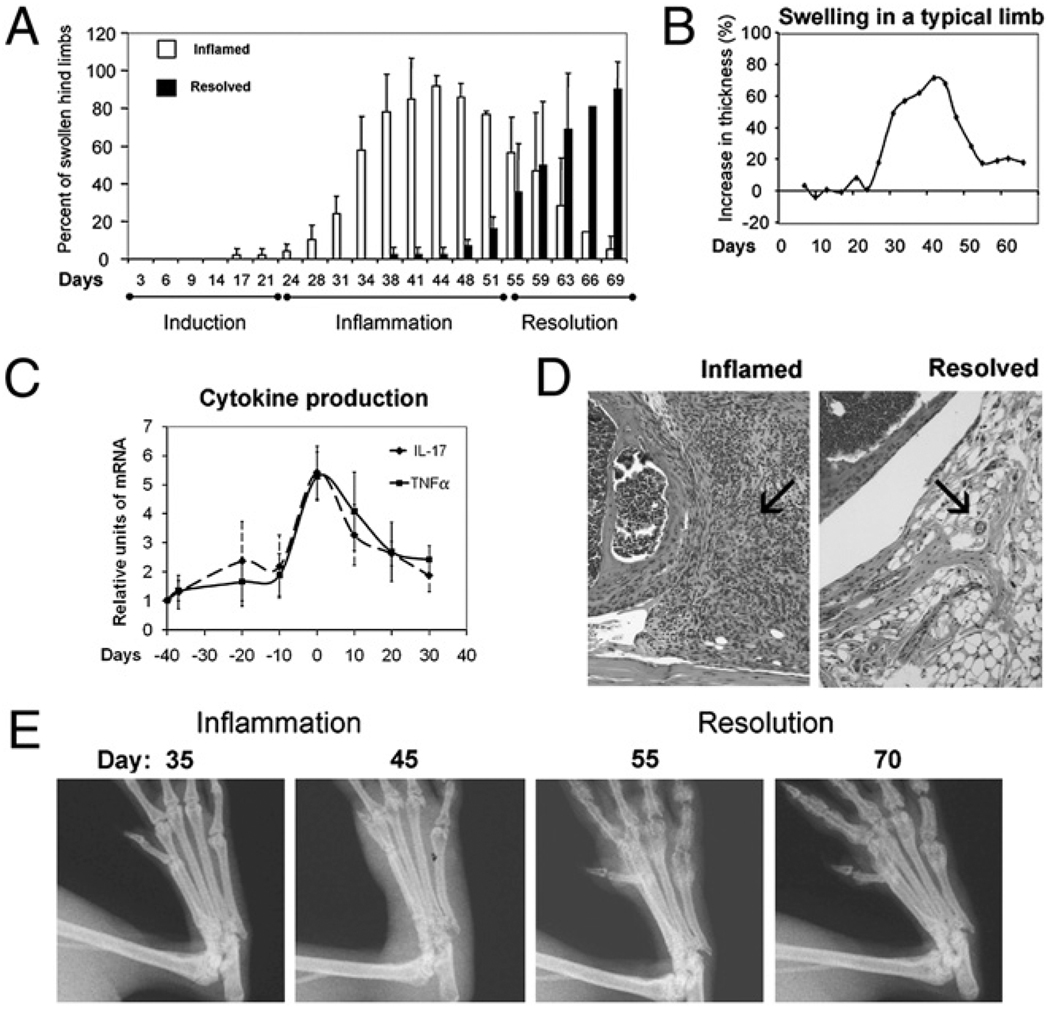
FIGURE 1.
Three phases of pathogenesis in arthritis. In A, open bars indicate the percent of footpads that have swollen by 20%. Filled bars indicate the percent of swollen limbs that have decreased by > 20% in thickness, n = 50–200. The number of footpads decreases as mice were sacrificed for cytokine analyses. Mean and SDs are plotted. The degree of swelling for each footpad was calculated as 100 × (thickness – thickness on day 0)/(thickness on day 0, range from 2.0–2.3 mm). B, The progression of inflammation in a typical arthritic limb is shown. In C, IL-17 and TNF-α mRNA were normalized against 18S RNA and then the relative level of expression was deduced. Three independent experimental repeats were performed. Within each experiment, 4–6 limbs from randomly selected mice were pooled, each data point is averaged from the three repeats, so total n = 12–18. The data were tested for normality, and unpaired one-way ANOVA, followed by Bonferroni test was used for statistical comparison. Their levels at peak of inflammation (day 0) were significantly different from when the joints were normal (day −40) or resolved (day +30), p < 0.05, but the levels in normal and resolved joints were not different, p > 0.05. D, H&E shows a highly cellular synovium in the inflamed (70% swollen at day 40) but not in the resolved (subsided from 91% to 12% swelling at day 70) knee joints (original magnification ×40). E, Sequential x-ray of representative metatarsal joints of a footpad is shown; note the subsiding of soft tissue swelling and the return of joint integrity and bone density in the fifth phalange.

