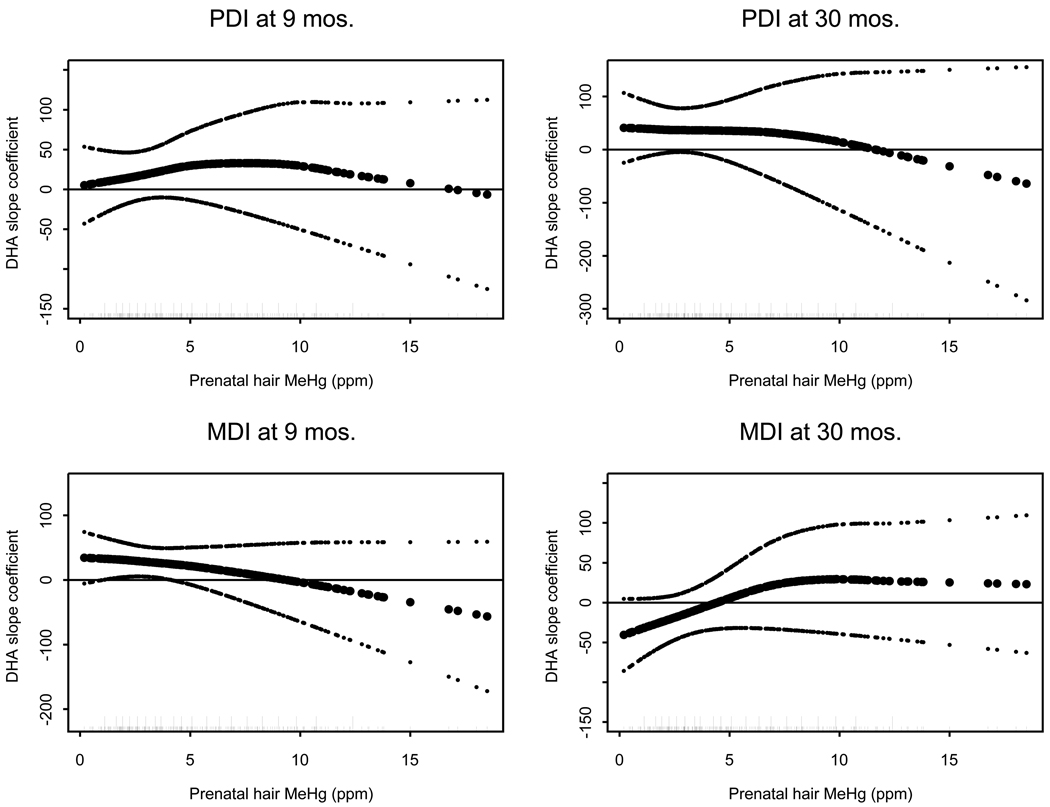
Figure 1.
Varying coefficient functions for the DHA slope values, for the four outcomes analyzed, as functions of prenatal MeHg exposure (ppm). Fitted points for coefficient functions are shown in black (▪), with a reference line at zero provided (---). Pointwise error bands are included, calculated as described in the text. All plots are from models fit using 20 knots with smoothing parameter controlled to give 3 degrees of freedom fit per varying coefficient function. Short tick marks along the abscissa indicate the location of MeHg values, and longer tick marks indicate the location of knot positions used in model fitting.

