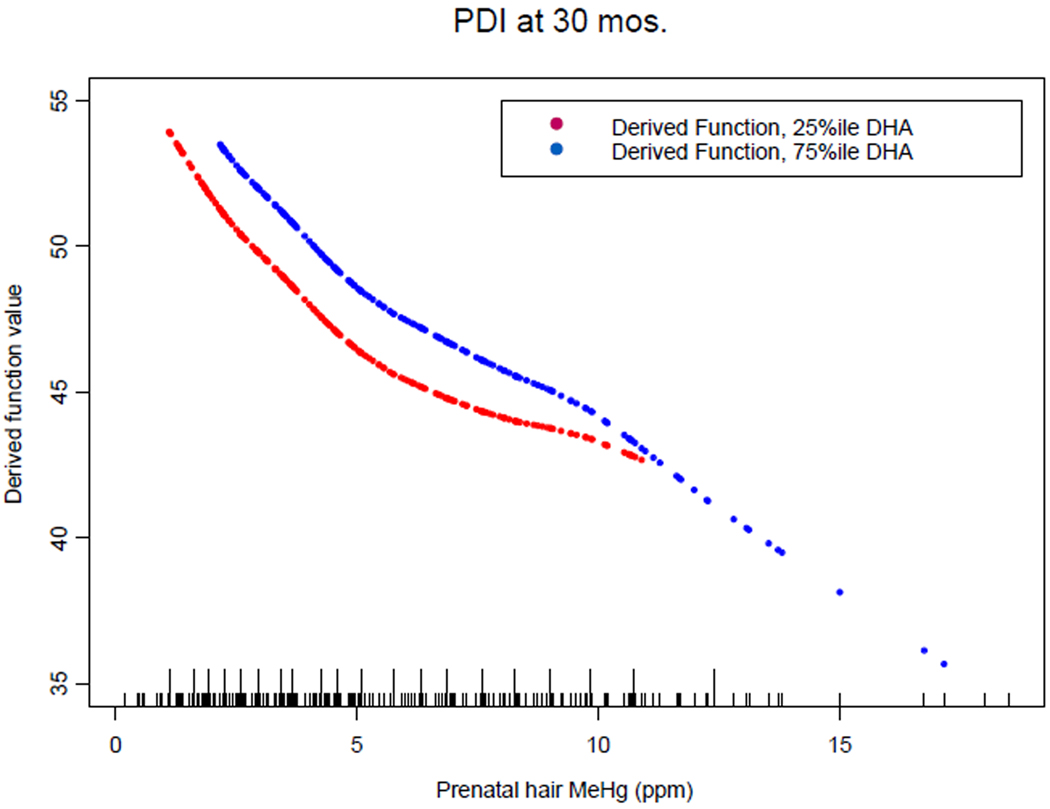
Figure 3.
Plot of derived function of overall MeHg and DHA combined effect on BSID-II PDI at 30 months, consisting of fitted VC intercept function added to DHA (Ω-3 LCPUFA) slope function*quantile of DHA. The quantiles shown are 25%ile ( ) and 75%ile (
 ). Models were fit using 20 knots with smoothing parameter controlled to give 3 degrees of freedom fit per VC function. Short tick marks along the abscissa indicate the location of MeHg values, and longer tick marks indicate the location of knot positions used in model fitting.

