Figure 4.
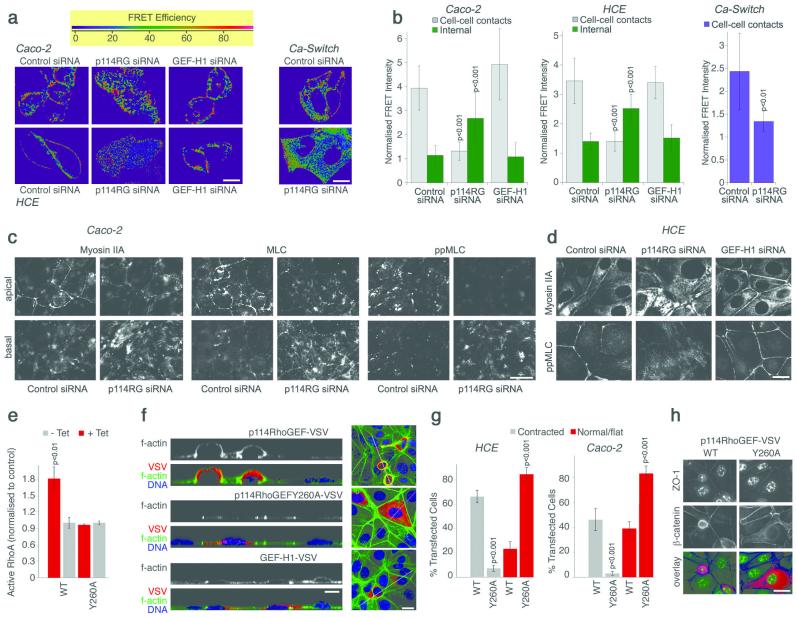
p114RhoGEF regulates RhoA signalling at cell junctions. (a-b) Cells were transfected with siRNAs and, after 2 days, with a RhoA FRET biosensor. RhoA activity was then imaged by gain of CFP fluorescence after acceptor bleaching. Shown are images of control, p114RhoGEF and GEF-H1 depleted cells taken from the apical part of the cells that contains the junctional complex (a; see Fig. S3a for basal sections). Images to monitor Rho activity during junction formation were taken between 1 and 2 hours after adding calcium (Ca-Switch). Images were quantified by normalising FRET signals in specific regions (cell-cell contacts or interior cytoplasm) with the total FRET signal in the quantified fields (b; averages ± 1SD; n: Caco-2, 30 for control and p114RhoGEF and 12 for GEF-H1; HCE, 20 for control, 14 for p114RhoGEF, 12 for GEF-H1; Ca-Switch, 10). (c-d) Caco-2 cells (c) and HCE cells (d), transfected with the specified siRNAs, were processed for immunofluorescence as indicated and analysed by epifluorescence microscopy. For Caco-2 cells, images taken form the apical and the basal regions are shown whereas a single image is shown for HCE cells that includes lateral and basal staining. (e) Levels of active RhoA were measured after tetracycline-induced expression of p114RhoGEF-VSV, labelled as WT, or p114RhoGEFY260A-VSV, labelled as Y260A, in MDCK cells. Shown are averages ± 1SD, n=3. (f) HCE ells were transfected with the indicated constructs for p114RhoGEF and GEF-H1 expression and then processed for immunofluorescence and confocal microscopy. Shown are z line scans and xy sections. Note, the contracted appearance of cells expressing active p114RhoGEF. (g) Images from samples as those in panel f for HCE cells and analogous samples generated with Caco-2 cells (Fig. S5a) were quantified by counting transfected cells with a rounded/contracted appearance and cells that remained normal/flat. Shown are averages ± 1SD, n=3. (h) HCE cells transfected as in panel f were stained for ZO-1 and β-catenin, and imaged by epifluorescence microscopy (the used antibody against ZO-1 crossreacts with a nuclear antigen in human cells). The overlay shows ZO-1 in green, β-catenin in blue and VSV in red. Bars, 10 μm.

