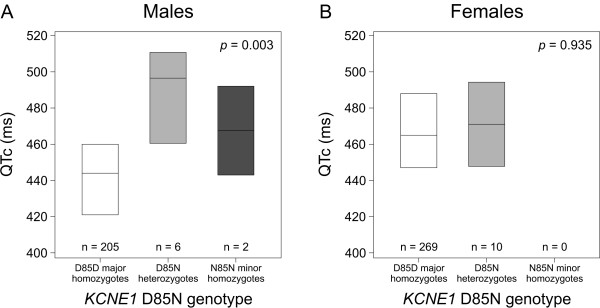
Figure 1.
QTc-interval duration in different KCNE1 D85N genotype classes in males and females with KCNQ1 G589D. Box plots show medians and interquartile ranges. The p values in linear regression analyses using additive genotypic model are shown for (A) males and (B) females separately. For interaction between D85N genotype and sex, p = 0.028. QTc, heart rate-corrected QT-interval.

