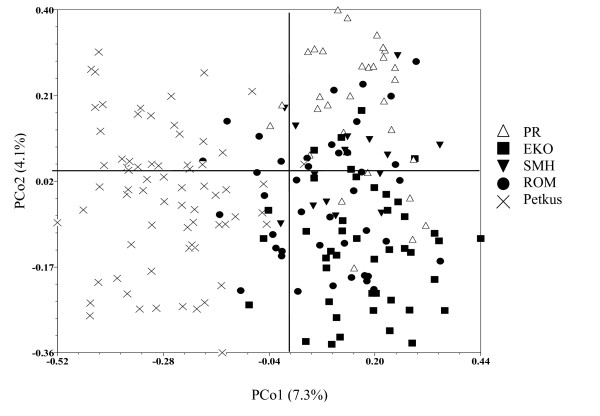
Figure 3.
Principal co-ordinate analysis of 201 rye lines from five populations (PR, EKO, SMH, ROM, Petkus) based on genome-wide SSR markers. Analysis was based on a similarity matrix from 37 SSR loci. PCo1 and PCo2 are the first and second principal co-ordinates and percentages indicate percent variation explained.

