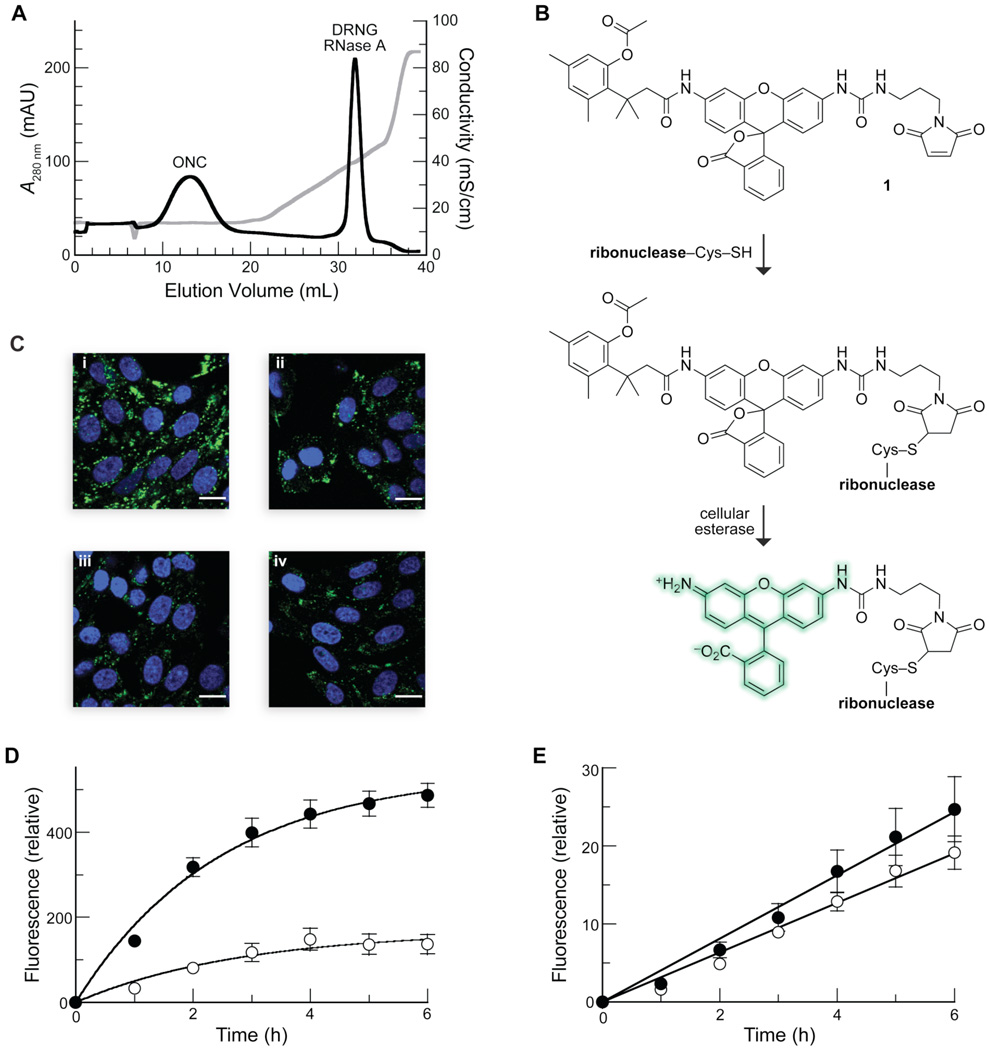
FIGURE 1.
Interaction of ribonucleases with GAGs in vitro and in cellulo. (A) Elution profile of DRNG RNase A and ONC from immobilized heparin. Ribonucleases (1.0 mg each) were loaded onto a column of immobilized heparin in PBS at pH 7.2. Protein elution was monitored by absorbance at 280 nm (black line) during a linear gradient of additional NaCl (0.00–0.45 M) (conductivity, grey line). ONC did not bind to heparin, eluting during the PBS wash (conductivity: 14 mS/cm). DRNG RNase A eluted at a conductivity of 40 mS/cm. (B) Scheme for the labeling of a ribonuclease with latent fluorophore 1. (C) Uptake of labeled DRNG RNase A (10 µM; i and ii) and ONC (10 µM; iii and iv) by CHO-K1 (i and iii) and CHO-745 (ii and iv) cells after incubation for 6 h at 37 °C. Nuclear stain Hoechst 33342 (blue) was added for the last 5 min of incubation. Scale bar: 10 µm. (D and E) Kinetics of uptake of labeled DRNG RNase A (10 µM; D) and ONC (10 µM; E) by detached CHO-K1 (●) and CHO-745 (○) cells. Total cellular fluorescence was measured by flow cytometry. Data points are mean values (±SE) for 20,000 cells from ≥6 cell populations. Initial rates of DRNG RNase A uptake were 220 ± 30 and 60 ± 20 RFU h−1 for CHO-K1 and CHO-745 cells, respectively. Initial rates of ONC uptake were 4.1 ± 0.2 and 3.2 ± 0.1 RFU h−1 for CHO-K1 and CHO-745 cells, respectively.

