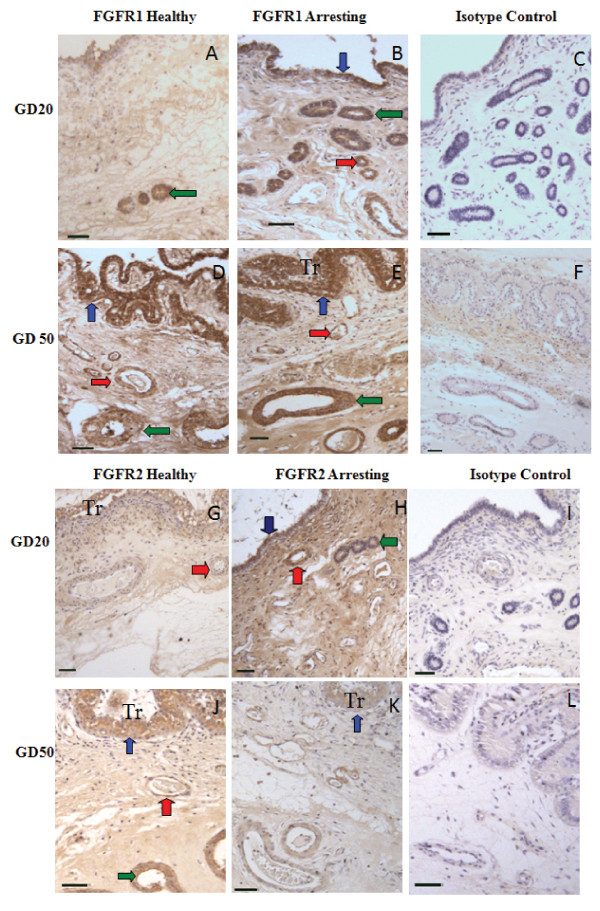
Figure 2.
Immunohistochemical localization of FGFR1 and FGFR2. FGFR1 (A-F) and FGFR2 (G-L) expression in endometrium from healthy (A, D, G, J) and arresting (B, E, H, K) conceptus attachment sites at gd20 and gd50. Expression of both receptors was associated with blood vessels (red arrows), luminal epithelium (blue arrows), and uterine glands (green arrows). Trophoblast (Tr) are visible in some sections. Size bars represent 100 μm.

