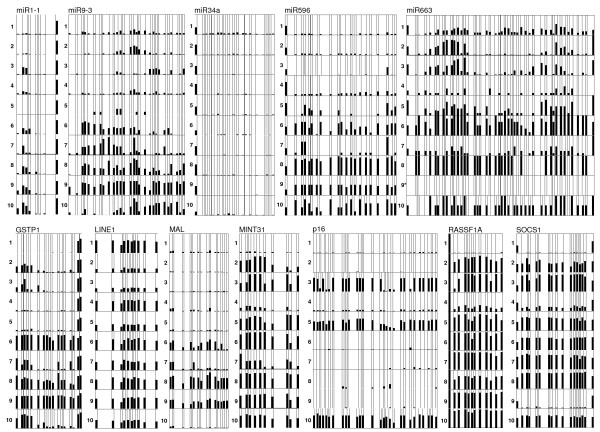
Figure 1.
Methylation profile of 12 loci in 10 HCC samples. Each column represents a CpG site in each DNA sequence. The names of the genes are listed above of each set. The sample number is labeled on the left side of each row. The color indicates the methylation level. White, no methylation; black, methylation. The proportion of black and white in each column indicates the percentage of sequences containing the methylated CpG sites at this position. The sequencing result of one sample (marked by an asterisk) did not pass the quality control (see Materials and Methods) and was not included in the figure.

