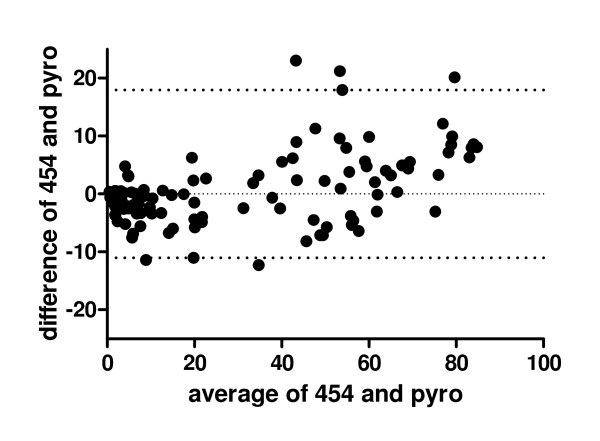
Figure 4.
Comparison of pyrosequencing and 454 sequencing using Bland-Altman Plots. Bland-Altman-Plot: Difference in methylation level obtained by both methods versus the mean of the methylation level for all 12 loci in all 10 samples. The individual Bland-Altman-Plots can be found in the Additional File 3. The upper and lower dotted lines indicate the 95% tolerance interval.

