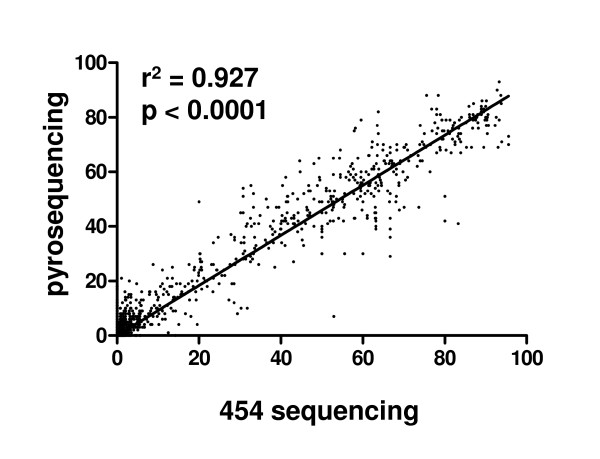
Figure 5.
Comparison of pyrosequencing and 454 sequencing using regression analysis. Regression analysis was performed for all individual measurements (methylation level of each individual CpG site under study, n = 869) obtained by the two methods. The excellent concordance of both methods is obvious (r2 = 0.927, p < 0.0001, slope: 0.918, 95% confidence interval: 0.9067 to 0.9300).

