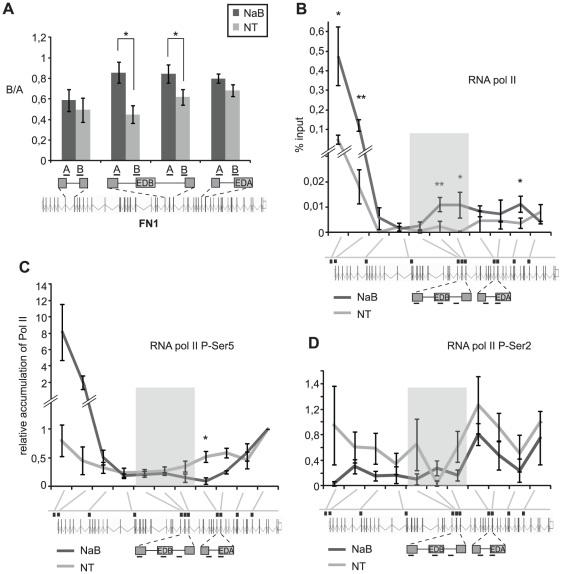
Figure 5. Pol II processivity correlates with exon skipping.
(A) Pol II processivity was determined as a ratio of two pre-mRNA sequences (B:A) along several regions of the FN1 gene. The abundance of given pre-mRNA locus was determined by quantitative PCR. The increased ratio after NaB treatment indicates higher Pol II processivity over the assayed region. Pol II exhibited high processivity increased significantly upstream and downstream of the EDB exon but not over consecutively spliced intron or alternative EDA exon that was not affected by NaB treatment. The average of three experiments is shown including SEM, * indicates p≤0.05 the t-test. (B-D) HDAC inhibition affects Pol II distribution. HDAC activity was inhibited by NaB for six hours and distribution of (B) total Pol II, (C) Pol II phosphorylated at the C-terminal domain Ser-5, and (D) Pol II phosphorylated at the C-terminal domain Ser-2 was assayed along the gene by chromatin immunoprecipitation. Probes detecting gene loci around alternative EDB exon are shaded. The tested gene loci are the same as in fig. 3. The average of three experiments is shown including SEM, ** indicates p≤0.01 and * p≤0.05 of the t-test.

