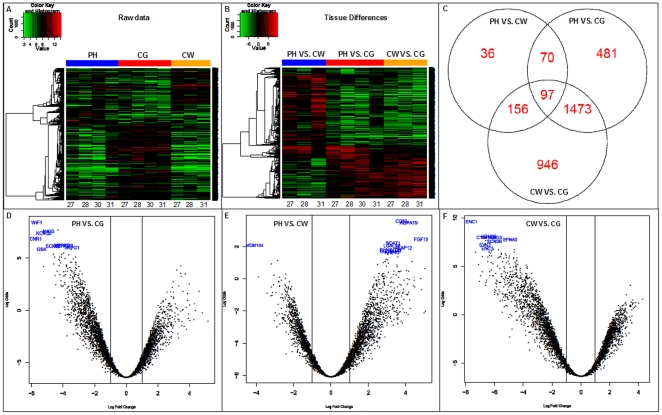
Figure 1. Raw data from the microarray analysis.
A and B) heat maps illustrating gene expression, C) Venn diagram of a total of 3,259 genes significantly regulated; D, E and F) volcano plots arranging the genes significantly expressed corresponding to the three comparison areas along dimensions of biological and statistical significance. PH (perihematoma), CW (contralateral white) and CG (contralateral grey).

