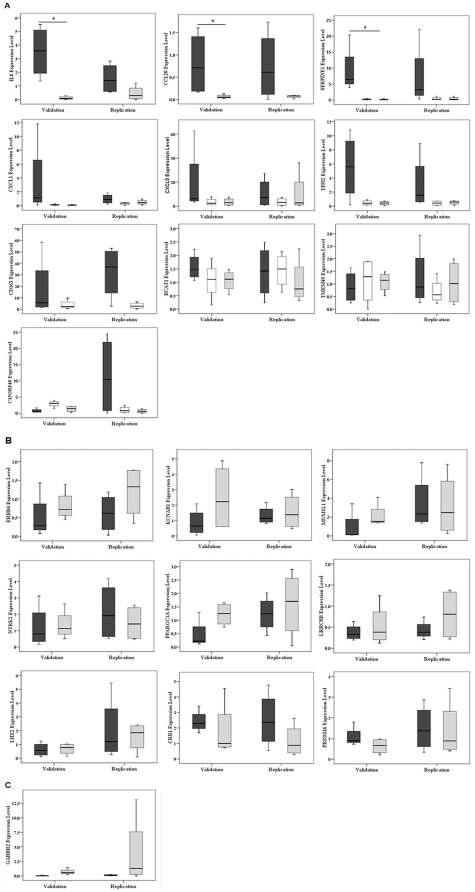
Figure 3. Complete quantitative RT-PCR validation and replication studies of overexpressed genes (A), underexpressed genes (B) and control-gene of grey matter (C).
Validation study was statistically significant for IL-8, CCL20 and SERPINE-1. Black bars represent PH (perihematoma), white bars CW (contralateral white) and grey bars CG (contralateral grey). Only the comparisons found differentially expressed in the main microarray study (as indicated in table 3) are shown here. Expression level is relative to calibrator sample *p<0.05.

