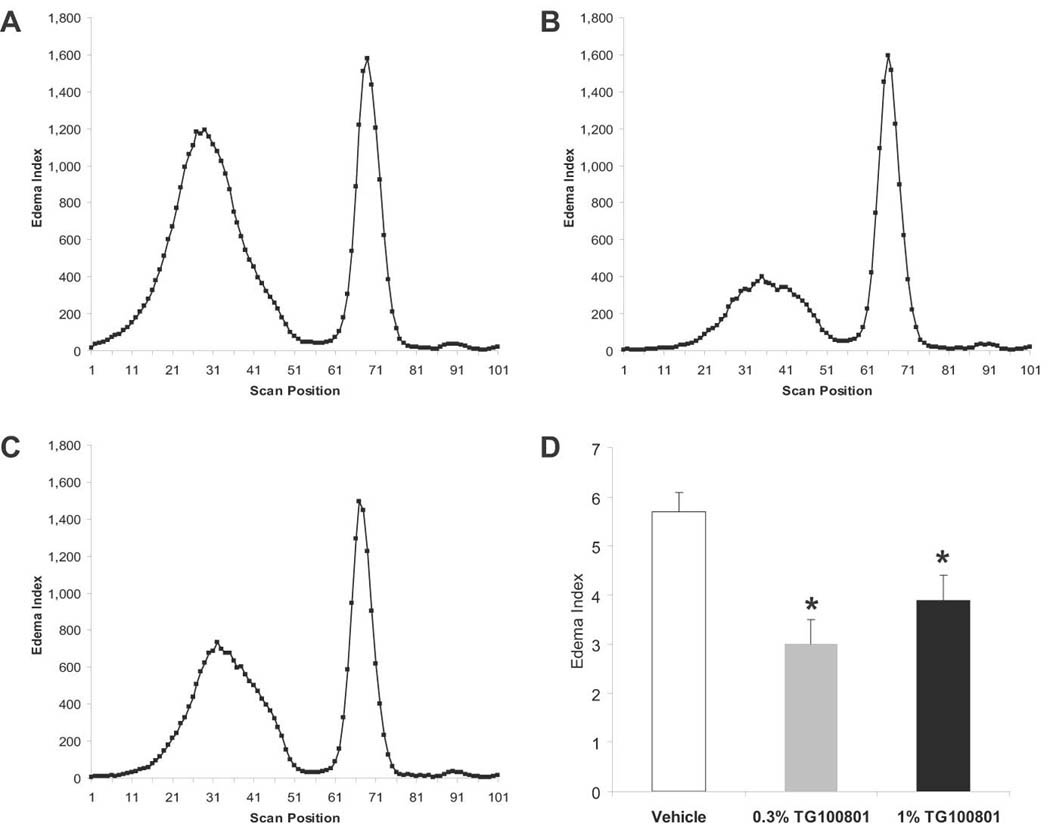
Figure 5. Fluorescein leakage after topical delivery of TG100801 in a rat model of retinal vein occlusion.

Retinal vein thrombosis was induced in the right eye of Long Evans rats, and both eyes were dosed topically twice a day with either vehicle or TG100801 (1% or 0.3% formulations). Following 5 doses, animals were injected i.p. with fluorescein and leakage into the retina and vitreous was quantified by ocular fluorophotometry. (A–C) Representative scans taken along the vertical axis from the three treatment groups; the peaks on the left represent fluorescein within the retina and vitreous compartments (A= vehicle, B= 0.3% TG100801, C= 1% TG100801) (D) Retina/vitreous peak area shown as an Edema Index corrected for basal vascular permeability in the non-thrombosed left eye (means ± SEM, n= 9–11; *, both TG100801 groups differ from vehicle group with P< 0.04).
