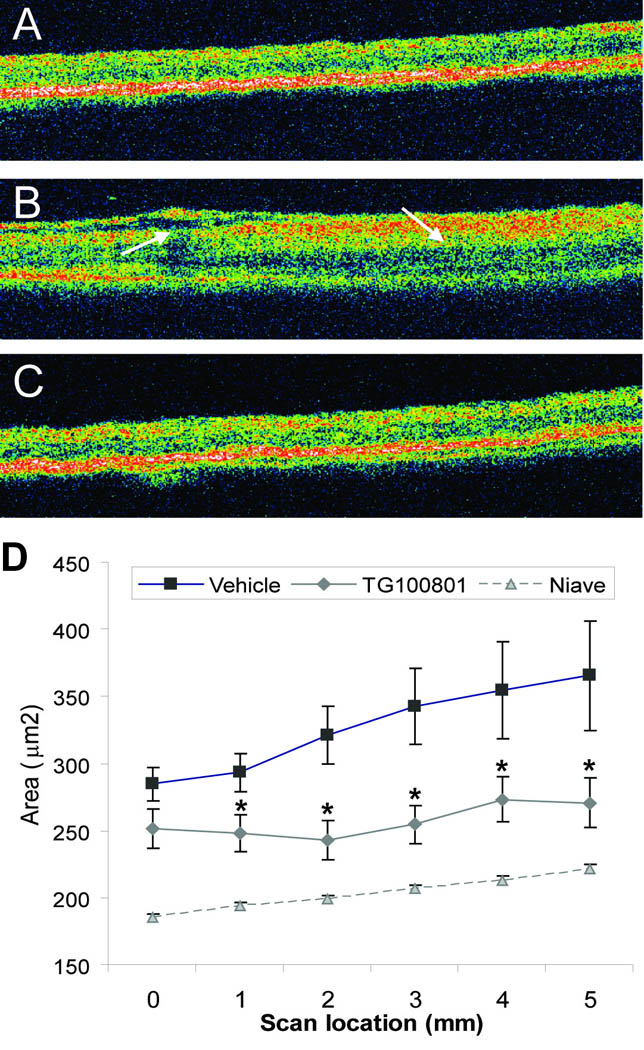
Figure 6. Retinal thickness after topical delivery of TG100801 in a rat model of retinal vein occlusion.

A retinal vein occlusion study was performed as described in Fig. 5, except that only one dose of TG100801 (1%) was investigated, and at study end retinal thickness was measured by optical coherence tomography (OCT; A–C). Representative OCT scans taken from naïve (A), thrombosed, vehicle-treated (B), or thrombosed, 1% TG100801-treated (C) animals. (D) Retinal area (µm2) determined from six 5 mm OCT scans (means ± SEM, n= 17–21; * TG100801 group differs from vehicle group with P< 0.05).
