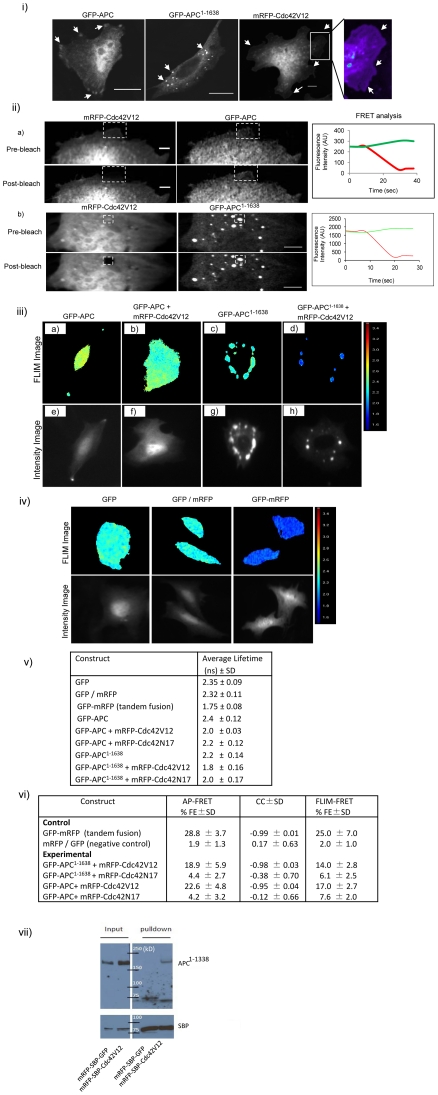
Figure 3. Localization and interaction of GFP-APC, GFP-APC1–1638 with Cdc42V12 or Cdc42N17.
(i) APC localization in CHO cells. Images showing the expression and distribution of exogenous GFP-APC, GFP-APC1–1638 and mRFP-Cdc42V12. The enlarged image of the box in the mRFP-Cdc42V12 panel is shown on the right. This pseudo-colored image shows mRFP-Cdc42V12 localization in lamellipodia (arrow heads). Scale bar = 5µm. (ii) Cdc42V12 interacts directly with GFP-APC and GFP-APC1–1638 (only the leading edges of CHO cells are shown). The line graphs on the right of the images show the FRET intensity analysis. Image processing was done by applying a low pass filter in Metamorph software to subtract out-of-focus blur. (a) Cells coexpressing mRFP-Cdc42V12 and GFP-APC. AP-FRET was carried out in the ROI at the cell edges (box). Images in the top row show the pre-bleach data and those in the bottom row show post-bleach data. (b) Cell coexpressing mRFP-Cdc42V12 and GFP-APC1–1638. FRET analysis was carried out with vesicles as shown by the ROI. The top and bottom rows show the pre- and post-bleach images respectively. Scale bar = 5µm. (iii) FLIM-FRET images of GFP-APC and GFP-APC1–1638 in CHO cells. The top row shows the FLIM image of (a) GFP-APC, (b) GFP-APC and mRFP-Cdc42V12 coexpression, (c) GFP-APC1–1638 and (d) GFP-APC1–1638 and mRFP-Cdc42V12 coexpression. The respective intensity image (e–h) of each FLIM image is given in the bottom row. (iv) FLIM-FRET control images. FLIM images of CHO cells showing cytosolic GFP, cytosolic GFP/mRFP coexpression (negative control) and cytosolic GFP-mRFP tandem fusion (positive control). The intensity image of the respective FLIM image is shown in the bottom panel. (v) Table describing the average lifetime data of GFP fusion proteins in the absence and presence of mRFP-Cdc42V12 or Cdc42N17 in CHO cells. Data is shown as average lifetime ± SD from three experiments with n = 8–15 for each experiment. (vi) Table showing percentage FLIM-FRET efficiency CC values of APC and APC1–1638 in presence of Cdc42V12 or Cdc42N17 along with positive and negative controls. Data is shown as ± SD, with three experiments and n = 7–10 cells for each experiment. (vii) Cdc42 co-immunoprecipitation assay for endogenous APC in SW480 cells. SBP was used as an affinity tag for pulldown. cDNA encoding mRFP-SBP-GFP (negative control) or mRFP-SBP-Cdc42V12 (experimental) were separately transfected into SW480 cells and allowed to express for 24 h. After cell lysis (see Materials and Methods for details) streptavidin-sepharose beads were used to pull down SBP-tagged fusion proteins. Proteins were then resolved by SDS-PAGE and transferred to PVDF membranes. The blots were probed for APC protein using APC antibody (Ab-5 from Calbiochem) and subsequently stripped and reprobed with streptavidin-HRP antibody to assess amounts of mRFP-SBP-GFP and mRFP-SBP-Cdc42V12.

