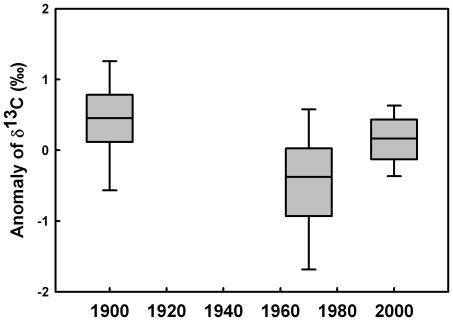
Figure 3. Long-term trend in anomalies of feather δ13C values (corrected by Suess and phytoplankton fractionation effects).
Anomalies were calculated independently for each subantarctic and subtropical penguin species (except the king penguin, see text for details). In the 1970s, δ13C anomalies were significantly lower than in the 1900s and 2000s (p<0.0001 and p<0.001, respectively).

