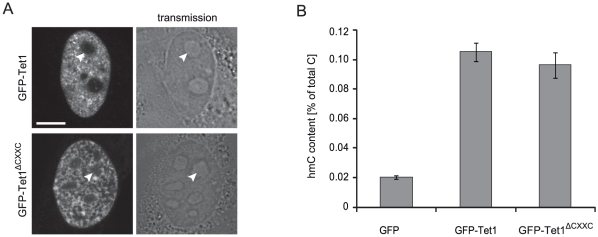
Figure 3. Cellular localization and in vivo catalytic activity of GFP-Tet1 and GFP-Tet1ΔCXXC.
(A) Live images of C2C12 myoblasts expressing GFP-Tet1. Scale bar: 5 µm. (B) Genomic hmC content in HEK293T cells overexpressing GFP, GFP-Tet1 and GFP-Tet1ΔCXXC. Shown are mean values and standard deviation of hmC percentage over total cytosine for three measurements from one transfection.

