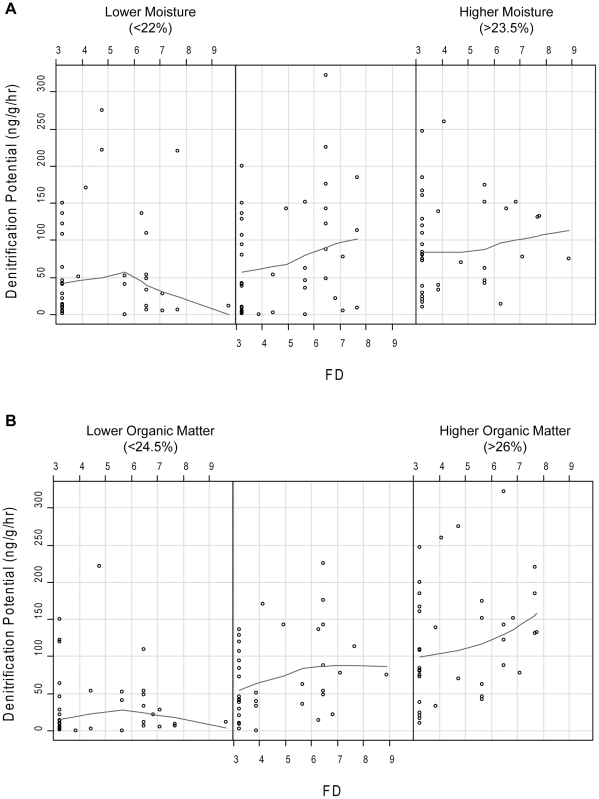
Figure 2. Coplots of denitrification potential (ng N g−1 hr−1) versus functional diversity (FD) conditional on the range of (A) soil % moisture and (B) soil % organic matter.
The lines are the lowess (locally-weighted scatterplot smoothing using least-squares) curves that follow the trends in the data.

