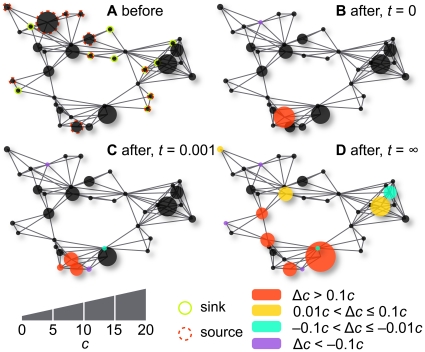
Figure 2. The procedure to measure robustness.
The figure illustrates a reaction system at equilibrium visualized by its reaction graph A, getting perturbed by redistributing the mass of (in this case two) metabolites B and how the system relaxes to another equilibrium (c,d). The concentration is illustrated by the size of the circles (the total mass, not the concentration is conserved, so the total areas of the circles are not the same in the different panels). The change in concentration is indicated by color. A metabolite unaffected by the perturbation is colored black.

