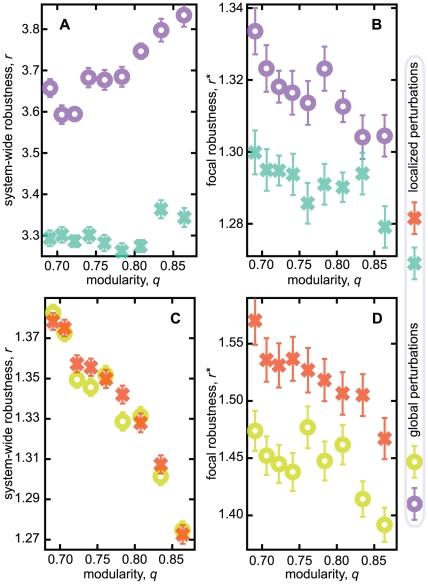
Figure 3. Robustness vs. modularity.
Panels A and B show data for the robustness against metabolic
perturbations. A displays robustness of the system as a whole; B shows
the robustness measured over the perturbed metabolites only. Panels C
and D show the corresponding plots for robustness against genetic
perturbations. Circles represent perturbations made in one module;
crosses indicate data for perturbations made in different modules. The
data is averaged over more than 500 runs (network realizations). The
errorbars in the average  are
smaller than the symbol size.

