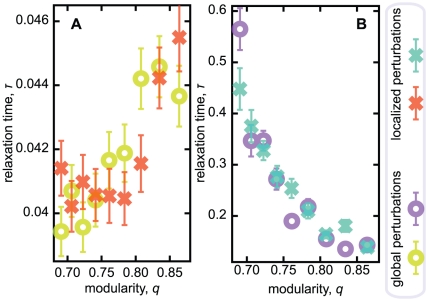
Figure 4. Relaxation time vs. modularity.
Panel A displays the corresponding data for perturbations in the concentrations of metabolites. Panel B shows the relaxation time for genetic perturbations within one module (circles) or the whole system (crosses). The data represents averages over more than 500 runs (the same runs as in Fig. 3).

