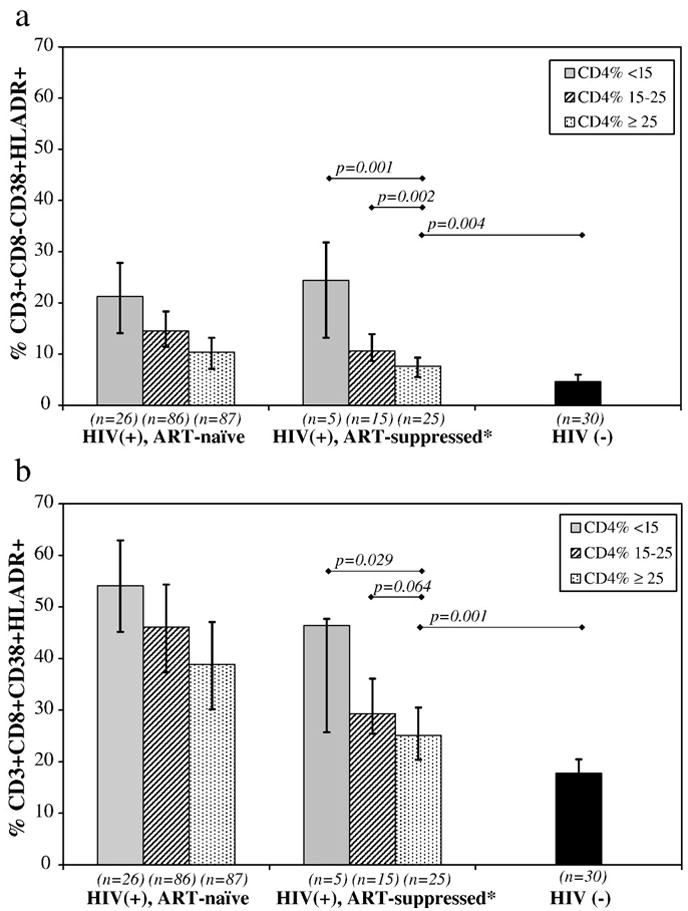
Figure 1.

Levels of T cell activation in T cell populations stratified by CD4% in Ugandan Children. The percentage of CD8− (a) and CD8+ (b) lymphocytes co-expressing CD38 and HLADR were determined by 4-color FACS Calibur flow cytometer (Becton Dickinson, San Jose, CA) using fresh peripheral blood mononuclear cells. Bar heights represent median values. Vertical lines represent interquartile ranges (25%–75%’ile). Horizontal lines indicate comparison by Wilcoxon Rank Sum, with applicable p values. *ART-treated ≥ 24 weeks with undetectable HIV plasma RNA.
