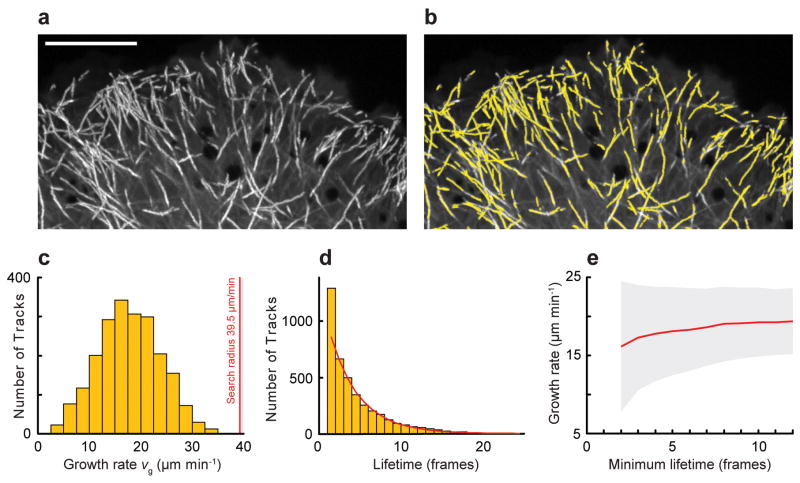
Figure 2. EB1-EGFP Object Tracking.
(a) Maximum intensity projection of EB1-EGFP time-lapse sequence (75 frames, 0.4 s frame−1). Growing microtubule ends appear as bright tracks. Scale bar, 10 μm. (b) Computer-generated growth tracks (yellow) with a minimum lifetime of 4 frames. (c) Histogram of growth velocities. The red line is the maximum search radius. (d) Histogram of growth track lifetimes. Red line, least-squares fit of a single exponential decay excluding the first data point. (e) Mean growth rates as a function of minimum growth track lifetime. Grey area, standard deviation.

