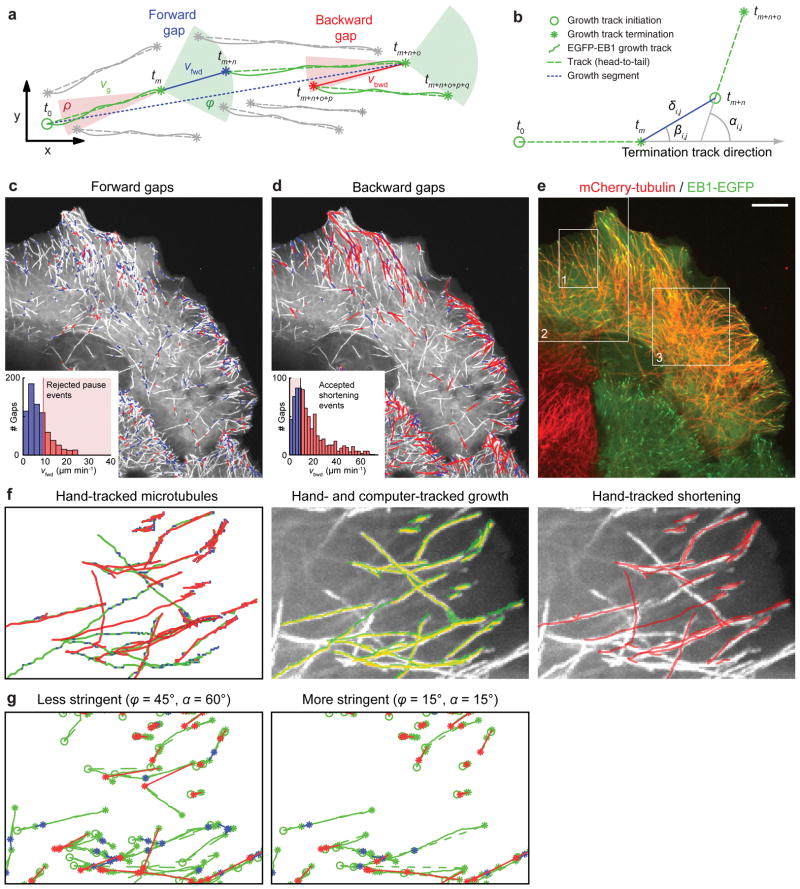
Figure 3. EB1-EGFP Growth Track Clustering.
(a) Schematic of growth track clustering. Green and red cones, spatiotemporal search space for candidate links to subsequent growth tracks at the end of a terminating growth track. Grey tracks with an initiation point inside a cone are not selected for linking by the clustering algorithm; gray tracks with an initiation point outside any cone do not participate in the clustering. vg, growth rate derived from EB1-EGFP tracks; vfwd and vbwd, inferred velocities of forward (blue) and backward (red) gaps, respectively; tx defines the time point of initiation or termination of a growth track. (b) Variables defining the cost of a candidate link between growth tracks. (c, d) Overlay of forward gaps (c) and backward gaps (d) on a maximum intensity projection of EB1-EGFP time-lapse sequence (97 frames, 0.6 s frame−1). Blue, slow gaps; red, fast gaps. Insets, histograms of forward (c) and backward (d) gap speeds and unimodal thresholds used to reject fast (c) and slow (d) gaps. (e) Image of cell expressing mCherry-tubulin and EB1-EGFP. Boxes indicate image regions used for validation. Scale bar, 10 μm. (f) Left, hand-tracking of 19 microtubules in region 1 indicated in (e). Periods of growth (green), shortening (red), and pauses (blue) are shown; middle, hand-tracked (green) and computer-tracked (yellow) growth; right, hand-tracked shortening overlaid on the EB1-EGFP maximum intensity projection of the entire sequence. (g) Track clusters obtained by two different settings for the cone openings. Color coding for lines, circles (growth track start) and asterisks (growth track and gap ends) as in (a).

