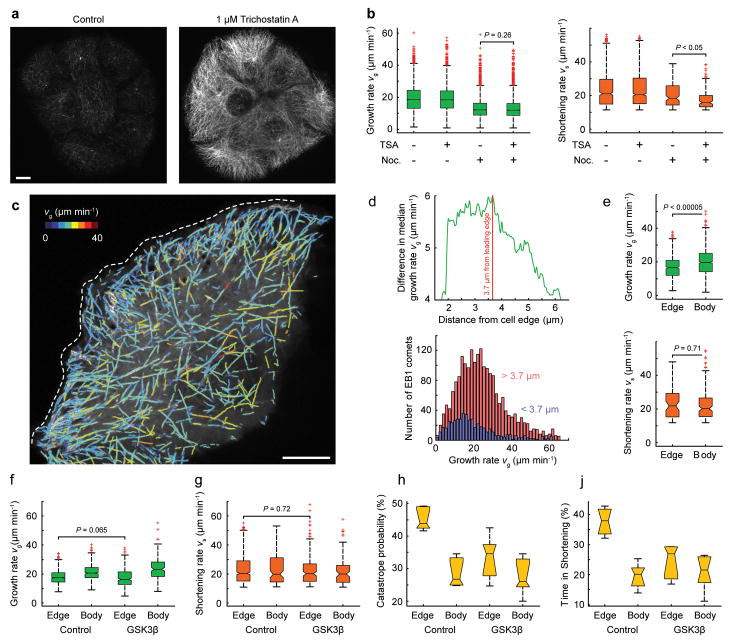
Figure 5. Effects of Tubulin Acetylation and Spatiotemporal microtubule Regulation in Migrating Cells.
(a) Immunofluorescence staining of acetylated microtubules in control and Trichostatin A-treated cells. (b) Growth and shortening rates in the presence of the indicated compounds. Data pooled from n = 3 cells (each distribution comprises n > 3000 measurements) and tested by permutation t-test (see Methods). (c) Computed growth tracks overlaid on a maximum intensity projection of an EB1-EGFP time-lapse sequence at the edge of a cell monolayer (77 frames, 0.4 s frame−1). Growth tracks are color-coded by growth rate as indicated; the dashed white line indicates the leading edge. (d) Difference in median growth rate of microtubule populations in the cell body (red) and cell edge (blue) as a function of distance from the edge. The plot below shows the regionally separated histograms of growth rates. (e) Growth and inferred shortening rates in the cell body and at the cell edge. (f) Growth and (g) inferred shortening rates, (h) catastrophe probability (estimated as the fraction of backward links in the total population of links), and (j) the time spent shortening, in regions of the cell edge compared to the cell body in control and GSK3β (S9A)-expressing cells. (e – g) Data pooled from n = 6 cells (distributions comprise n > 3000 measurements) and tested by permutation t-test (see Methods). Scale bars, 10 μm.

