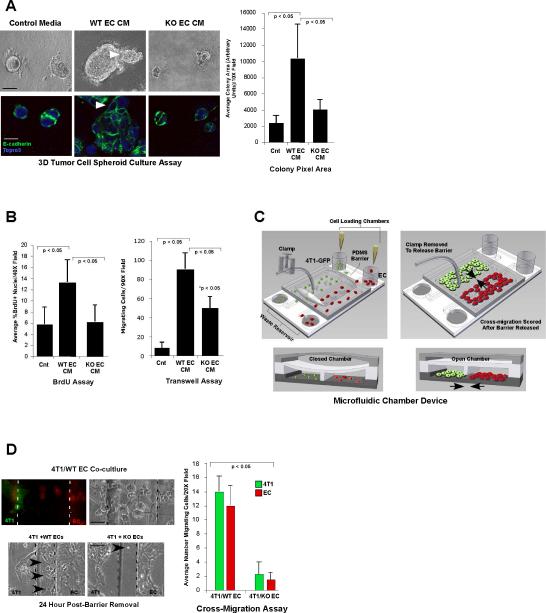
Figure 1. `Angiocrine' signals from endothelial cells enhance tumor cell growth and motility, which is diminished in the absence of endothelial EphA2 receptor function.
(A) Upper panels show photomicrographs of 4T1 tumor cell spheroids cultured in control base medium (Optimem/2% FCS) versus conditioned medium (CM) from wild-type (WT) or EphA2-deficient (KO) endothelial cells (EC). Lower panels show confocal images of spheroids stained with E-cadherin (green) and Topro3 (blue) nuclear counterstain. Arrowheads indicate invasive protrusions. Colony size was quantified based on pixel area of 4 independent colonies/photomicrograph in replicate cultures from 3 to 5 independent experiments. Scale bar = 25 μm upper panels, 10 μm lower panels. (B) 4T1 tumor cell proliferation in two-dimensional culture was scored by BrdU incorporation, and 4T1 tumor cell migration was measured by transwell assay. (C) Schematic for microfluidic chamber device. Tumor cells (4T1-GFP, green) and endothelial cells (CellTracker Orange dye labeled, red) were seeded into two adjacent cell culture chambers separated by a narrow PDMS barrier. Release of the valve barrier permits cross-migration of both cell types through the central chamber. Arrows indicate direction of cross-migration through the open chamber upon barrier removal. (D) Cross-migration of tumor cells and endothelial cells was quantified simultaneously based on cell morphology and differential fluorescent labeling. Arrowheads indicate cells that migrated into the central chamber (boundaries between cell chambers and central chamber marked with dashed lines). Scale bar = 10 μm upper panels, 50 μm lower panels. Data are a representation of 3 to 5 independent experiments using conditioned medium/cells from at least three independent WT versus KO EC isolates for all cell culture experiments. Graphs display average ± standard deviation.

