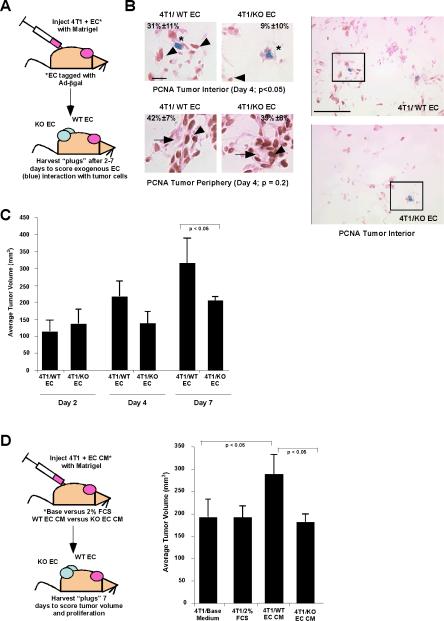
Figure 2. Effect of `Angiocrine' signals from endothelial cells on tumor growth in vivo.
(A) Schematic for tumor cell-endothelial cell co-transplantation experimental design. 4T1 tumor cells were ad-mixed with WT or KO EC (labeled with adenovirus encoding β-galactosidase), resuspended in growth factor-reduced Matrigel, and injected subcutaneously into the dorsal flank of recipient mice. The resulting tumors were harvested 2 to 7 days post-injection for analysis. (B) Proliferation of tumor cells in proximity to exogenous EC (blue*) within the interior of the tumors for WT versus KO EC was quantified based on nuclear PCNA staining (arrowheads), 4 days post-transplantation (p <0.05), as well as proliferation in the tumor periphery, where tumor cells are proximal to host blood vessels (arrows). Right hand panels show lower magification photomicrographs, with boxed areas indicating regions shown in higher magnification panels on left. Scale bar = 10 μm (left hand panels) or 50 μm (right hand panels). (C) Tumor volume was scored over time at day 2, 4, and 7 post-transplantation. (D) Schematic for tumor cell-endothelial cell CM co-transplantation experimental design. 4T1 tumor cells were ad-mixed with 5× concentrated CM from WT or KO EC versus control base medium, resuspended in growth factor-reduced Matrigel, and injected subcutaneously into the dorsal flank of recipient mice. The resulting tumors were harvested 7 days post-injection for analysis. Tumor volume was measured at day 7. Data were consolidated from 6 to 10 independent animals/condition in at least two experiments, using conditioned medium/cells from at least three independent WT versus KO EC isolates for all in vivo studies. Graphs display average ± standard deviation.

