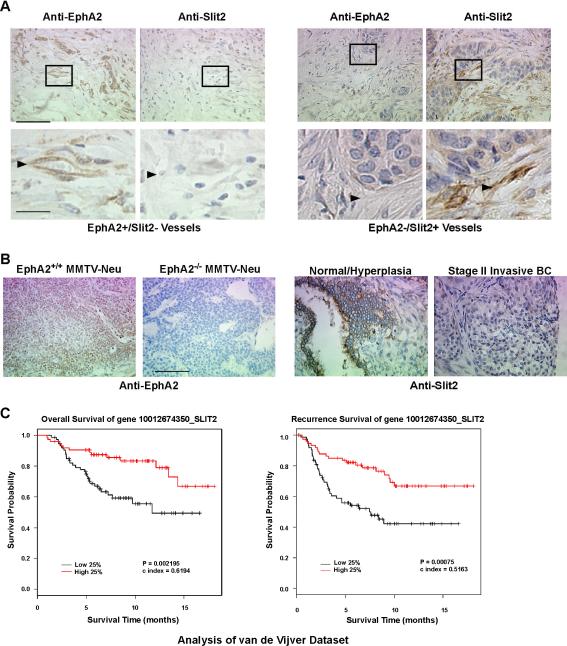
Figure 5. EphA2 and Slit2 expression profiles in human breast cancer.
(A) EphA2 and Slit2 protein expression in human invasive ductal carcinoma samples was analyzed in breast cancer tissue microarrays (TMA; Cybrdi, Inc.). Representative photographs of EphA2-negative /Slit2-positive tumor blood vessels (left), and of EphA2-positive/Slit2-negative (right) tumor blood vessels, are shown. Arrowheads indicate tumor blood vessels. 17 out of 53 samples harbored EphA2-positive/Slit2-positive tumor vessels, compared with 36 out of 53 samples with tumor vessels that were EphA2-postive/Slit2-negative (p = 0.009 Chi Square Test). Scale bar = 50 μm upper panels, 10 μm lower panels. (B) Controls for EphA2 antibody specificity. MMTV-Neu tumor tissue sections from EphA2 WT and KO animals were stained with anti-EphA2 antibodies. Slit2 protein was detected in tumor parenchyma of normal/hyperplastic human breast tissue epithelium, but not in tumor epithelium from Stage II invasive breast cancer, in TMA samples. Scale bar = 50 μm. (C) Kaplan-Meier kinetic analyses of the van der Vijver dataset, with microarray profiles of 295 human breast tumors and associated clinical data. The impact of elevated slit2 expression on overall survival and recurrence-free survival was analyzed by Log-Rank tests.

