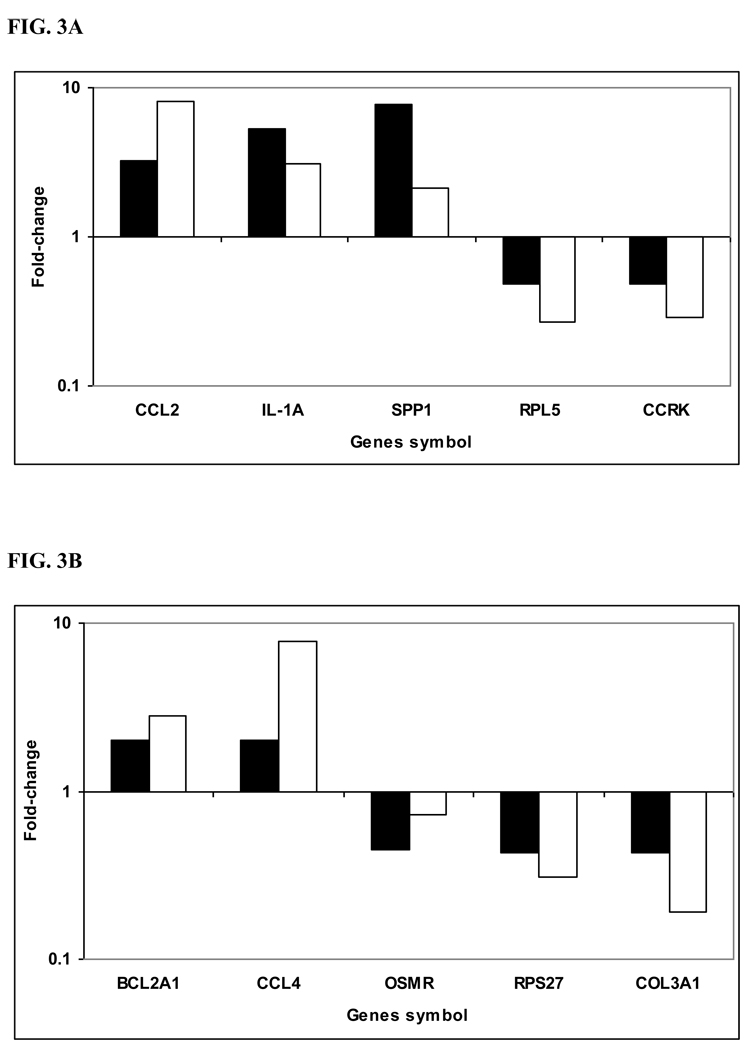
Figure 3. Validation of microarray results by quantitative Real Time - PCR.
cDNA was synthesized from the same RNA samples used for microarray hybridization. Ten selected genes that were differentially expressed based on microarray analysis between B. abortus-infected susceptible bovine MDMs (A) and B. abortus-infected resistant bovine MDMs (B) at 12h p.i. as compared with non-infected cells (control), were validated by quantitative RT-PCR. Fold-change was normalized to the expression of GAPDH and calculated using the ΔΔCt method. All the genes tested had fold-changes in the same direction by both methodologies and 9 of 10 were also altered greater than 2-fold. Solid bars indicate microarray fold-change, open bars indicate qRT-PCR fold-change.

