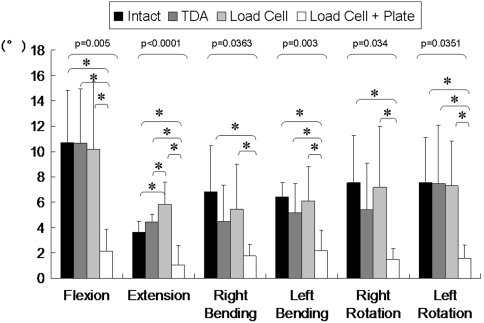
Fig. 2.
A graph shows surgery-level (C4–C5) motions (mean and SD) at the final loading step (2 Nm). The motion decreased after fusion with a plate compared to the intact. TDA restored the motion to the intact value. The p value using one-way analysis of variance (ANOVA) is shown on the graph. *The asterisks show significant difference using post-hoc Fisher multiple comparison analysis.

