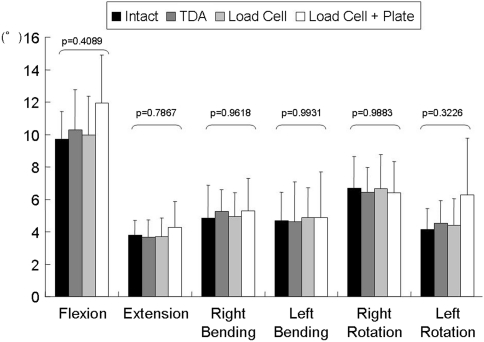
Fig. 3.
A graph shows adjacent-level (C5–C6) motions (mean and SD) at 2 Nm. The motion was similar for the bone graft with the plate case in flexion and in extension, compared to the intact case. The motion was close to the intact case for the TDA case. No difference among any groups was seen by one-way analysis of variance (ANOVA).

