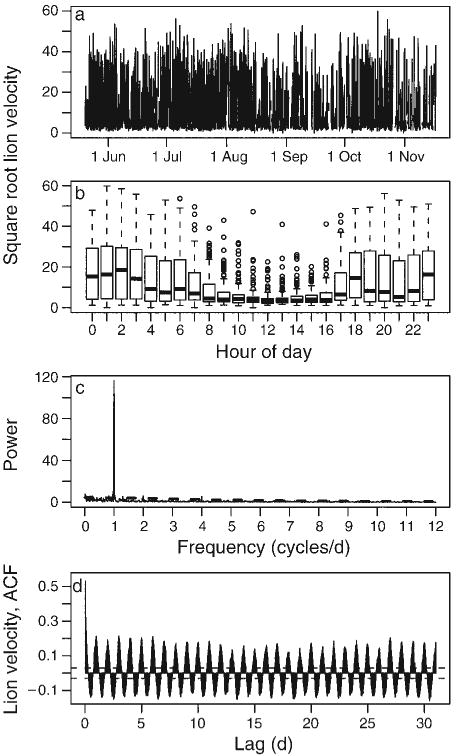
Fig. 1.

Square-root transformed lion (Panthera leo) velocity (m/h before transformation) shown (a) as a time series and (b) as box plots of velocity by time of day where the thick line denotes the median value, the box extends from the 25th to the 75th percentiles, and the whiskers extend to 1.5 times this interquartile range. (c) Fourier periodogram normalized so that the theoretical white-noise spectrum is at the constant power value of 1; the theoretical spectrum of a red-noise data model is shown by the dashed line. The strong peak at 1 cycle/day reflects an overall daily behavioral sequence of resting during the day with increased activity at night. For comparison with time domain methods, panel (d) shows the estimated autocorrelation function (ACF), with the horizontal lines drawn at corresponding to the approximate 95% confidence intervals for a white-noise data model.
