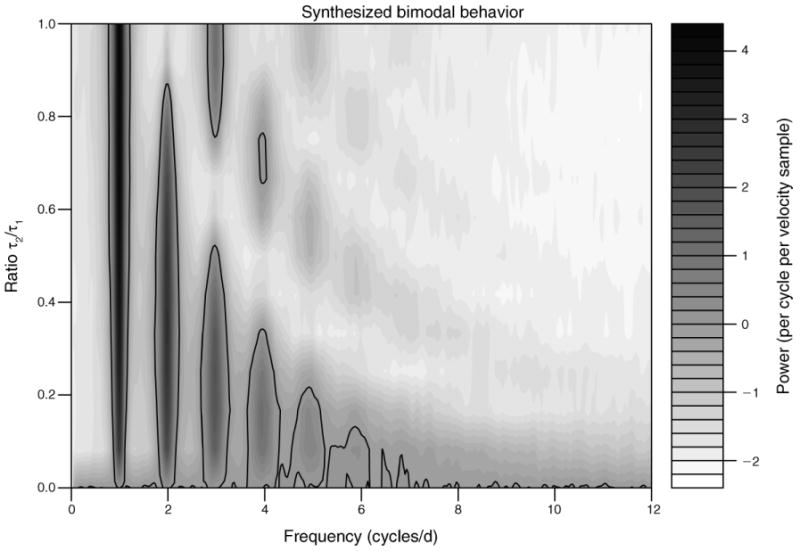
Fig. 2.

Contour plot of loge-transformed, averaged normalized periodogram values (power) from 100 simulated movement trajectories consisting of daily bimodal behavior. The daily behavioral sequence is given by the movement mode set SK = {m2, m3} with the values of mi as defined in Methods: Stochastic movement model. The expected time spent in mode 2 was varied among {0, 1, …, 12} to span a movement complexity of no behavioral switching (τ2 = 0, i.e., a random walk), to evenly partitioned switching (τ2 = τ1 = 12 hours, i.e., symmetric bimodal behavior). For each ratio we simulated 100 continuous movement paths and sampled locations each hour for 30 days. Lines are contoured at the levels of loge(1) = 0 and enclose regions of frequencies with power larger than that expected by white noise. SK is the number of distinct movement modes; m2 is movement mode 2, and m3 is movement mode 3, as defined in Methods: Stochastic movement models; τ1 and τ2 are expected temporal durations for m1 and m2, respectively. Grayscale units are in power per cycle per velocity sample, where power is the periodogram value.
