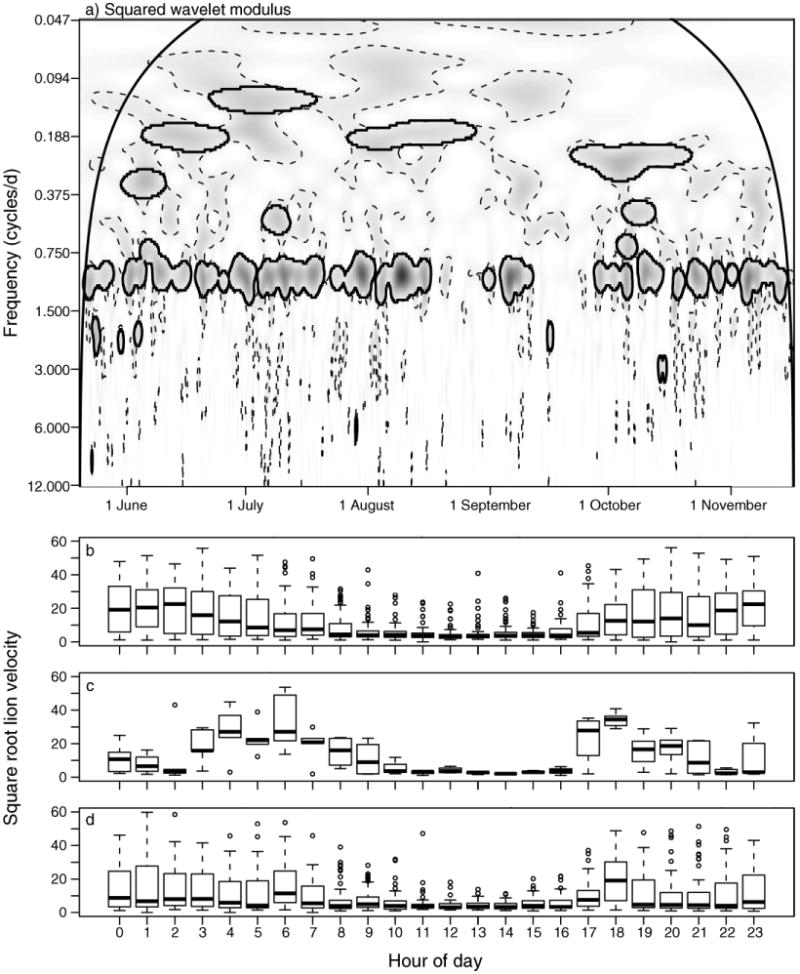
Fig. 5.

(a) Wavelet analysis of lion velocity data (smaller values are given by lighter colors and larger values by darker colors) shows a dominant, yet transient, 1, 2, or no cycles/day behavior. Significant patches are defined as those that lie inside the solid black closed lines, which delineate patch area remaining from an areawise test of patches defined by 95th estimated percentiles obtained from 1000 bootstrapped white-noise null-model time series, delineated by dashed lines. The cone of influence is delineated by the smooth, arched solid black line. (b–d) Tukey box plots, where the thick line denotes the median value, the box extends from the 25th to the 75th percentiles, and the whiskers extend to 1.5 times this interquartile range, of square-root transformed velocity (m/h before transformation) grouped by hour of day for different partitions of the data: (b) times during which scalogram values at 1 cycle/day are significant and explain a greater proportion of the variance than scalogram values at 2 cycle/day, indicating a basic active–rest cycle; (c) times during which scalogram values at 2 cycles/day are significant and explain a greater proportion of the variance than scalogram values at 1 cycle/day, identifying several active nights during which a secondary rest period occurs; (d) box plots without significant scalogram values at 1 or 2 cycles/day, identifying nights with less activity.
