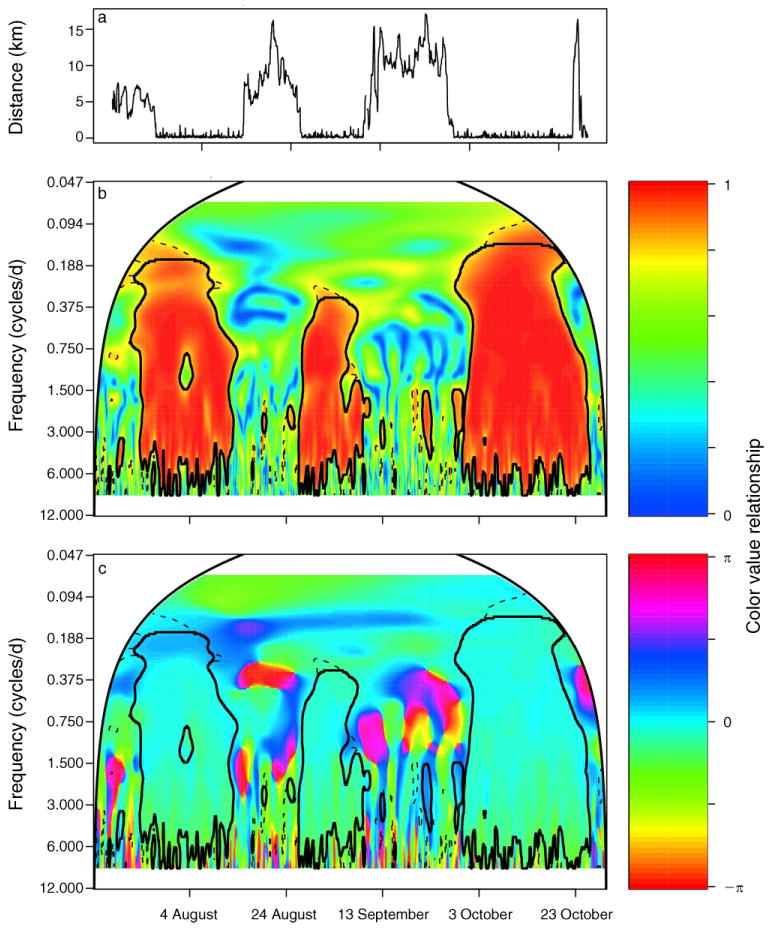
Fig. 6.

Analyses of two African buffalo (Syncerus caffer; T12 and T13 in Table 1) in July through October 2005: (a) the distance between them, (b) their wavelet coherency, and (c) wavelet coherency phase differences, where the color-value relationship is shown by the color bars to the right of each contour. Wavelet coherence values <1 indicate uncorrelated noise, a nonlinear relationship between the velocity of T12 and T13, or that the processes influencing T12's or T13's velocity are not identical. In panels (b) and (c), significant patches are defined as those that lie inside the solid black closed lines, which delineate patch area remaining from an areawise test of patches defined by 95th estimated percentiles obtained from 1000 bootstrapped white-noise null-model time series, delineated by dashed lines, while the cone of influence is delineated by the smooth, arched solid black line.
