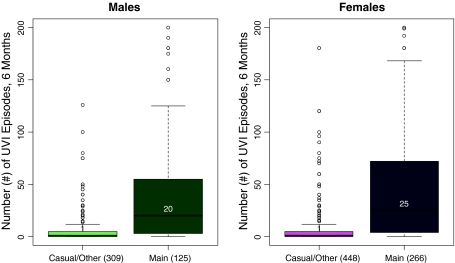
Fig. 4.
Distribution of per partner UVI episodes in the prior 6 months among respondent-partner observations, by sex and partner type. Note: Values in parentheses reflect the total number of respondent-partner observations. Boxes represent the interquartile range, and the dark horizontal line indicates the median

