Figure 7.
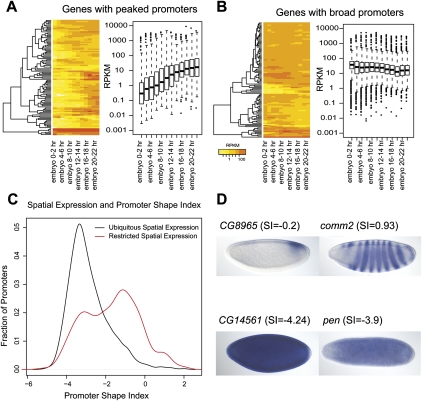
Correlation of temporal and spatial gene expression patterns with peaked and broad promoters. (A) Temporal expression profiles of 100 genes whose promoters have the highest SI scores (peaked promoters) are highly variable across a time course of embryonic development, with reads per kilobase per million (RPKM) values fluctuating between <1 (yellow) and >100 (red). The average RPKM value among these genes with peaked promoter is 0.3 at the 0–2-h time point and gradually increases to 10 at the 22–24-h time point. Expression profiles of genes with peaked promoters were also highly variable in the time course, ranging over an order of magnitude between the first and third quartiles (box plots). (B) Temporal expression profiles of 100 genes whose promoters have the lowest SI scores (broad promoters). The average RPKM is 60 across all time points. The first and third quartile RPKMs of genes with broad promoters were within one order of magnitude of the average RPKM, or between 10 and 80 across all time points. (C) Distribution of the shape index (SI) for spatially restricted genes (red) and ubiquitously expressed genes (black). (D) Representative embryonic gene expression patterns in whole-mount embryos, stages 4–5, restricted (upper two panels) and ubiquitous (lower two panels).

