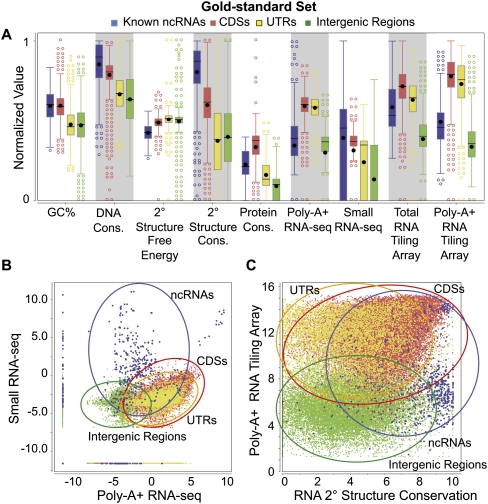
Figure 1.
Distributions of nine genomic feature values. The distributions of values of the nine features are shown for the gold-standard set (for the definition of the gold-standard set, see Supplemental Methods) of the four types of genomic elements: known ncRNAs, coding sequences (CDSs), untranslated regions (UTRs), and intergenic regions. The values of each expression feature are the maximum of the corresponding values from all the expression data sets of the same type. (A) Box plots of individual features (normalized values). (B) Two-dimensional scatter-plot of the maximum small RNA-seq signal against the maximum poly-A+ RNA-seq signal. (C) Two-dimensional scatter-plot of the maximum poly-A+ RNA tiling array signal against the predicted secondary structure conservation. Expression values in B and C are the log-transformed normalized read counts (DCPM, depth of coverage per million reads).

