Figure 6.
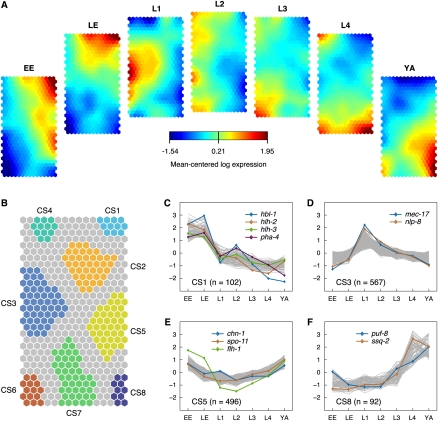
Expression patterns during C. elegans development. (A) Component planes of a self-organizing map (SOM) fitted to the developmental stage data set. Each component plane visualizes mean-centered gene expression (log2-scale) in one stage as a color gradient from blue to red indicating low and high expression, respectively (see color bar): EE indicates early embryos; LE, late embryos; L1, larvae stage 1; L2, larvae stage 2; L3, larvae stage 3; L4, larvae stage 4; and YA, young adults. (B) Eight regions (CS1–CS8) of the SOM, which robustly clustered together, are color-coded (see main text for details). (C–F) Mean-centered log2-expression values of genes corresponding to four of the clusters in B are plotted for the 50% of best-fitting genes (additional clusters in Supplemental Fig. S20). Colored lines indicate the expression of a selected subset of genes (see key). mec-17 and nlp-8 encode neuron-enriched transcripts; chn-1 and spo-11 are highly expressed in the adult hermaphrodite gonad; puf-8 is highly expressed in embryonic and adult germline; and ssq-2 encodes a sperm-specific transcript. For other labeled genes, see Results.

