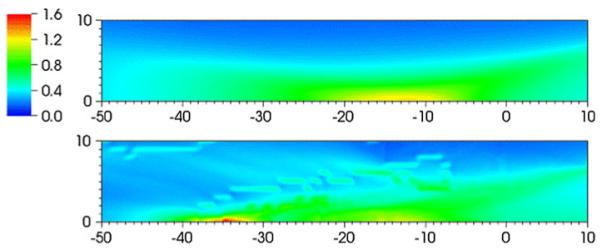
Fig. 13.

Flooded contour plot of maximum shear strain (%) in the neighborhood of the focus or the Dornier HM3. The units of distance on the abscissa and ordinate are in mm. The focus is at (0,0). Results for the water bath case (top) and using VOXEL-MAN Group data (bottom)
