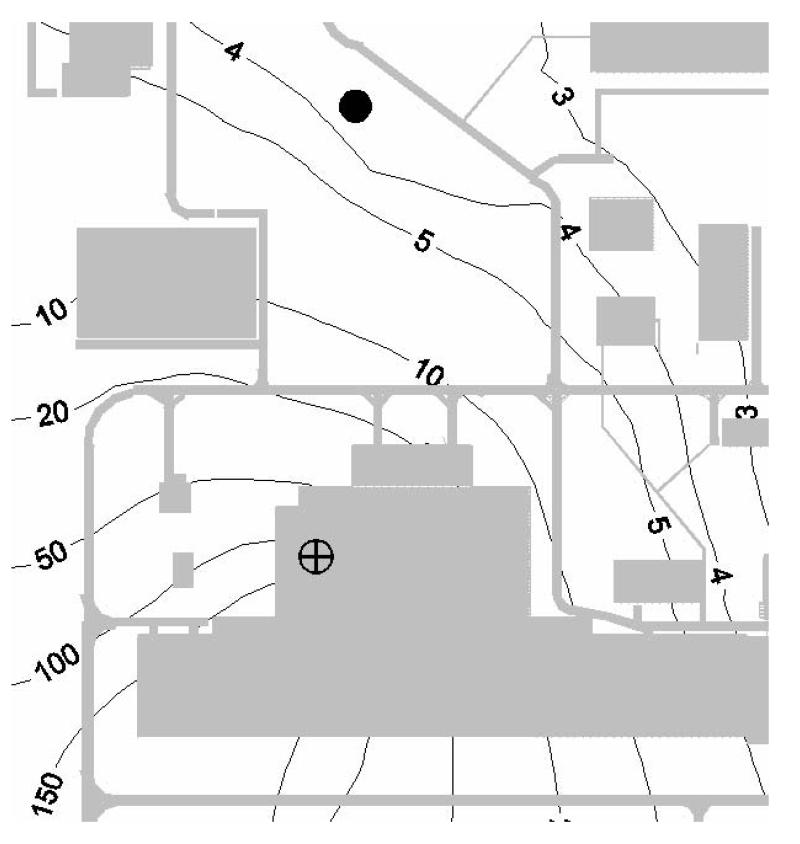
FIG. 3.
Spatial pattern of exposure rates (R h−1) at the ChNPP industrial site on May 26, 1986. Position of reactor No. 4 is marked with crossed circle; the location of the point considered in Fig. 4 is marked with shaded circle. Gray objects represent NPP buildings and roads.

