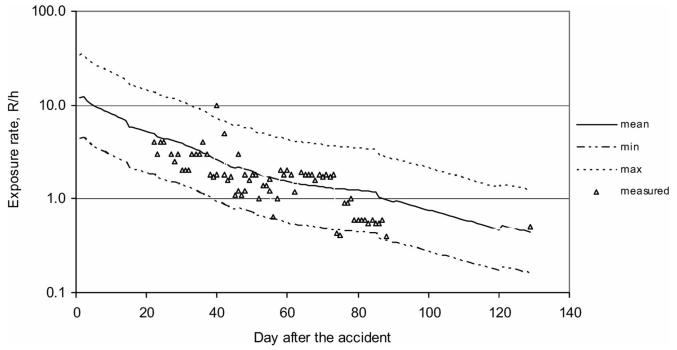
FIG. 4.
Time course of exposure rate (R h−1) at the ChNPP industrial site. Triangles mark measurement data, the solid curve the estimated mean dose rate in this area, and the dashed lines the estimated maximum and minimum exposure rates for this area. See Fig. 3 for the location of the measurement point.

