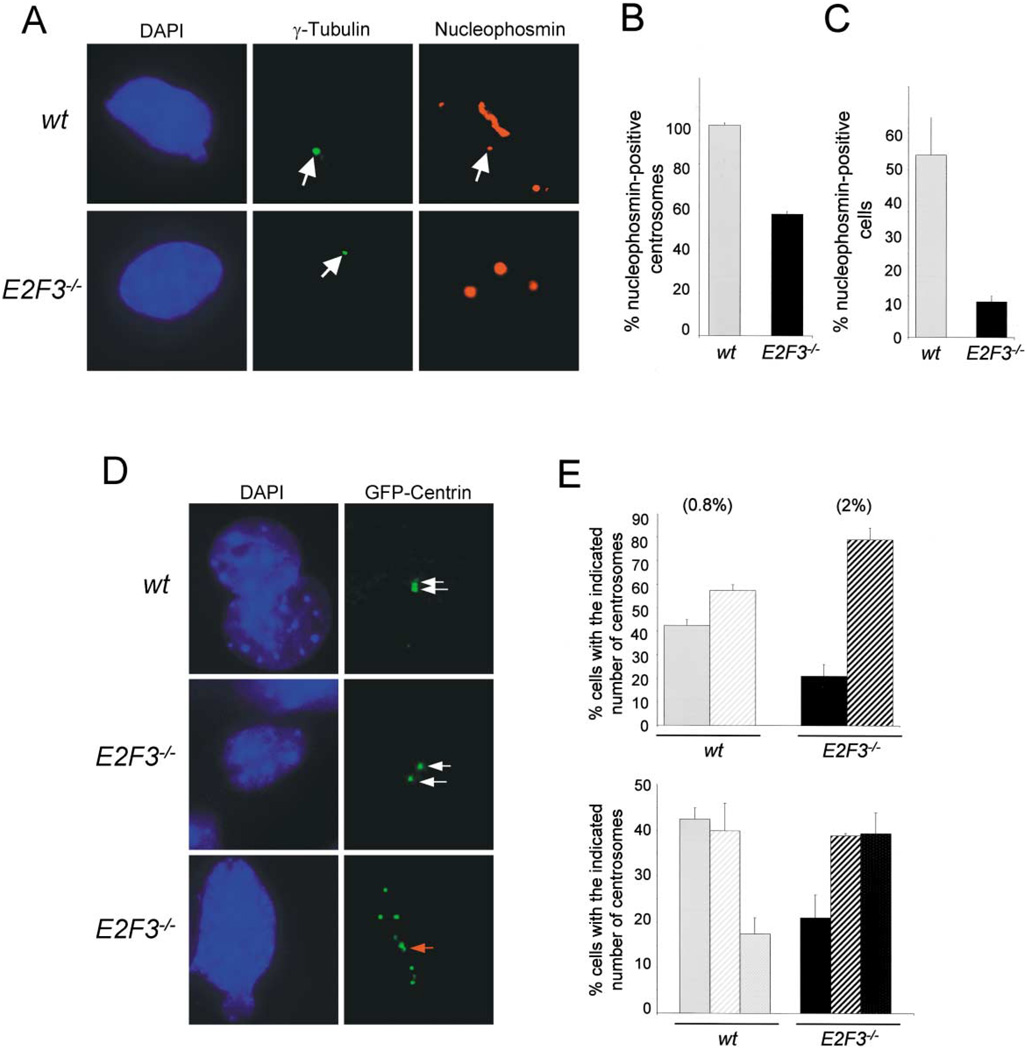
Figure 8. Deregulation of cyclin E-dependent kinase activity in E2F3−/− cells leads to premature centriole separation.
A: Coimmunostaining of γ-tubulin (middle panels) and nucleophosmin B (right panels) in cells cultured under serum-starvation conditions.
B: Percentage of nucleophosmin B-positive unduplicated centrosomes in wild-type ( ) or E2F3−/− (■) cells under serum starvation conditions.
C: Percentage of cells with nucleophosmin B-positive centrosomes in the total population of wild-type ( ) or E2F3−/− (■) cells cultured under serum starvation.
D: Wild-type and E2F3−/− cells expressing GFP-centrin-2. Shown from top to bottom: a wild-type cell with an unduplicated centrosome, prior to the separation of centrioles; an E2F3−/− cell with a separated centrosome; an E2F3−/− cell with multiple, separated centrioles. The left panels show the corresponding DAPI-stained nuclei. White arrows indicate individual centrioles while the red arrow indicates a separated centriole associated with a nascent centriole.
E: Top panel, percentage of wild-type ( ) or E2F3−/− cells (■) containing one (solid bars) or ≥2 separated centrosomes. Bottom panel, percentage of wild-type (
 ) or E2F3−/− cells (■) containing unduplicated (solid bars), ≥2 separated and unduplicated (stripes), or ≥ 2 separated and duplicated centrosomes (dotted) in density-arrested conditions. Centrioles were visualized using GFP-centrin-2, and the calculated percentages are based on the results from counting 100 cells. Shown in parenthesis are the percentage of BrdU-positive cells in the population.

